

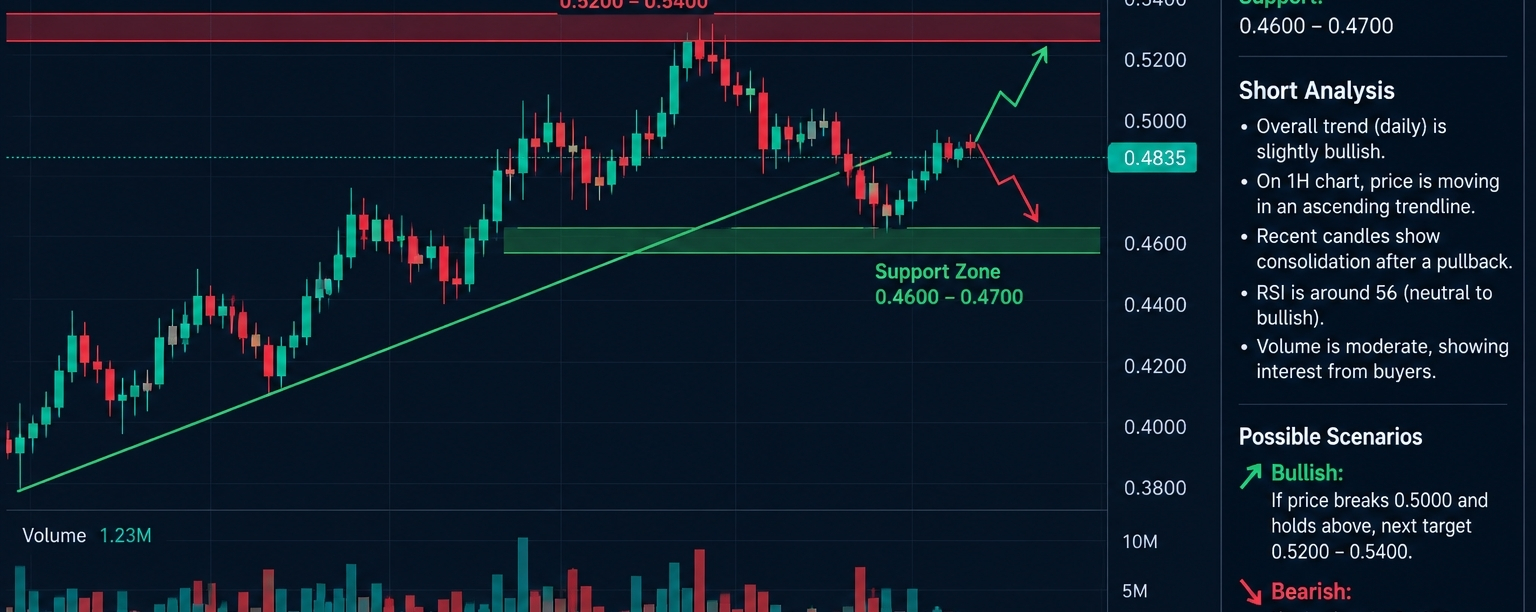

JCT/USDT — Short Candle Analysis
Candle chart par trend samajhne ke liye 15-minute aur 1-hour timeframe dekhein:
Green candles: buying pressure ho sakta hai.
Red candles: selling pressure ho sakta hai.
Resistance: jahan price ko upar jana mushkil ho.
Support: jahan price ko neeche girne se support mil sakta hai.
Volume: price movement ki strength samajhne mein madad karta hai.
Latest available trend: JCT has shown bullish momentum on the daily timeframe, but the 15-minute chart showed short-term selling pressure in data from October 27, 2026.
Candle chart: View JCTUSDT on TradingView