$TSLA.US 📊 TSLA Short-Term Candle Analysis
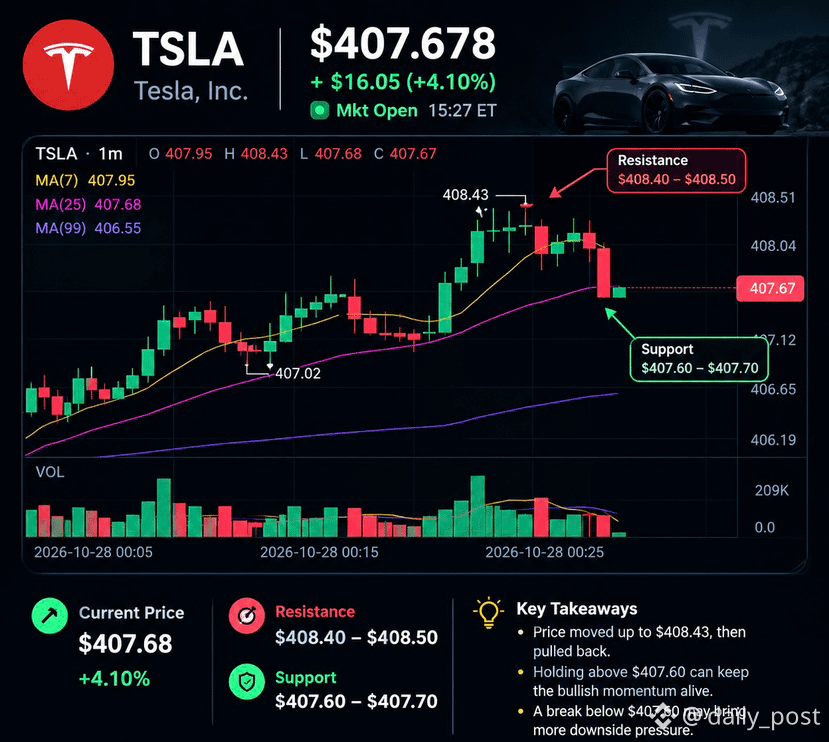
TSLA is trading around $407.68, up about 4.10%. The 1-minute chart shows a strong push toward $408.43, followed by a pullback.
🟢 Support: $407.60–$407.70
🔴 Resistance: $408.40–$408.50
If candles break and hold above $408.50, short-term bullish momentum could continue. A move below $407.60 may bring further pullback pressure.
Watch the next few candles for confirmation. 📈
Not financial advice.
#TSLA #stocks #TradingTales #CandleChart