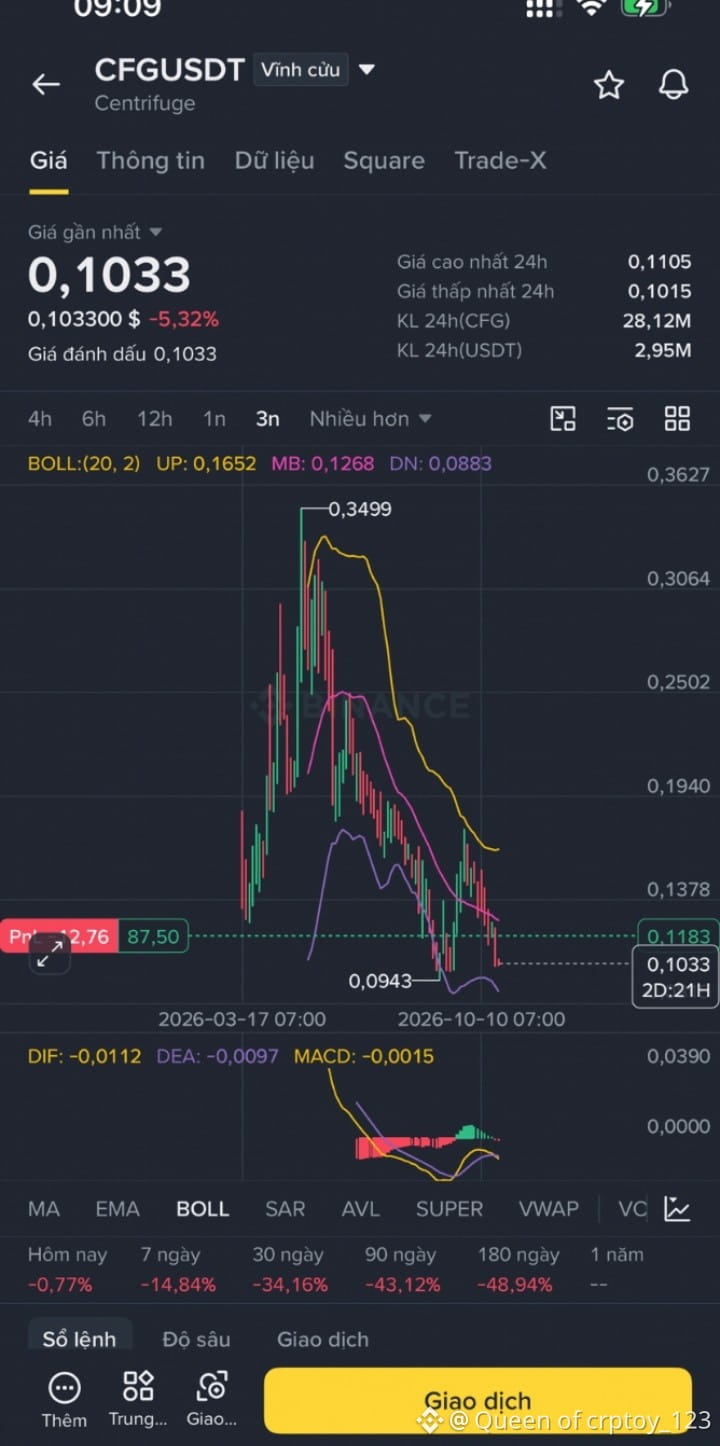
🚀 Catch the Bottom Bounce on $CFG
! 📈
• Entry Price: $0.1020 - $0.1040
• TP1: $0.1150
• TP2: $0.1280
• TP3: $0.1450
• Stop Loss: $0.0920
Reason: $CFG has retraced heavily into a major horizontal accumulation zone near the $0.0943 support level and is testing the lower Bollinger Band on the 3-day chart. The MACD histogram shows selling momentum slowing down, suggesting a strong potential relief rally or technical bounce back toward the middle Bollinger band resistance and key moving averages.