$ZEC
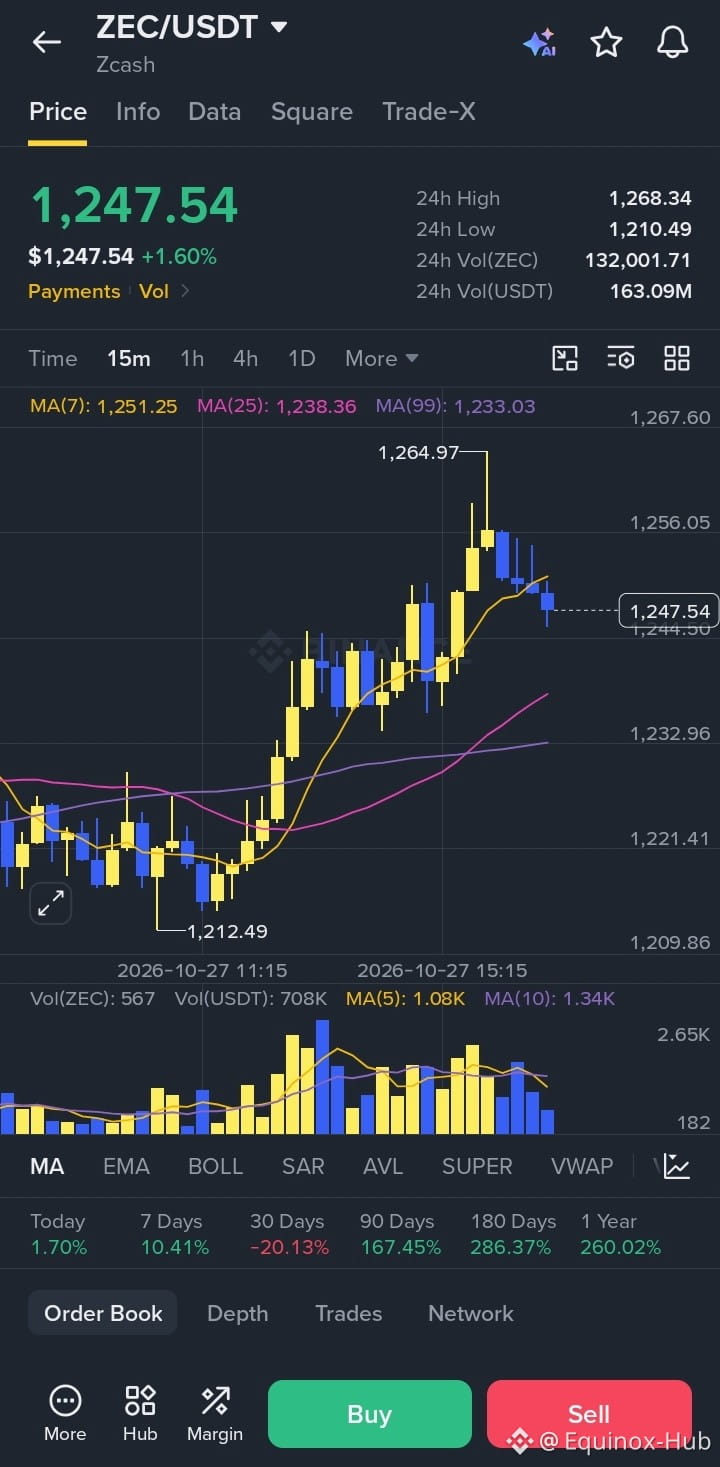
/USDT is riding a clean 15m uptrend — price just cooled off near the highs.
K-Line Analysis
Structure: Clear higher highs and higher lows since the ~1,214.71 base. The move is impulsive with strong green candles, especially the big green body that pushed through previous resistance.
Current candle: Small red body near 1,250.60 after tagging 1,264.71. This looks like a mild pullback/profit-taking rather than a reversal still holding above the short-term MAs.
Moving Averages:
MA5 (1,252.21) > MA10 (1,247.09) > MA30 (1,233.54) → bullish alignment.
Price is slightly below MA5 but still comfortably above MA10 and MA30. The MA5 is acting as dynamic resistance on this pullback.
Volume: Healthy expansion on the upside legs, with some cooling on the recent red candles. No major volume climax yet that would scream exhaustion.
MACD (12,26,9): Still positive and above the zero line (MACD 1.16, DIF 6.59, DEA 5.42). Histogram is green and the lines are not crossed down yet → momentum remains on the bullish side.
Key levels from the chart:
Immediate resistance: 1,254.70 → 1,264.71 (recent high)
Stronger resistance: 1,268–1,270 zone (24h high area)
Support: MA5/MA10 cluster (~1,247–1,252) then 1,239.70 and the rising MA30 (~1,233.50)
Overall bias on the 15m: Bullish continuation as long as price stays above the MA10/MA30 zone. The recent red candle is a normal pullback inside an uptrend.
Trade Plan (15m bias)
Bias: Long / Buy the dip
Setup: Pullback to support in an uptrend
Entry zones (limit or market on bounce):
Preferred: 1,247 – 1,252 (MA5/MA10 area)
Aggressive: current price (~1,250.60) if it holds and turns green
Deeper (higher R:R): 1,239 – 1,242 if it dips further
Stop Loss:
Tight: below 1,239.70 (recent swing low area)
Safer: below MA30 / 1,230–1,233
Take Profit targets:
TP1: 1,260 – 1,264 (previous high)
TP2: 1,268 – 1,272 (24h high extension)
TP3: 1,280+ (if momentum continues and volume expands)
Risk Management:
Risk only 0.5–1% of account per trade
Move SL to breakeven once TP1 is hit
Trail with MA10 .