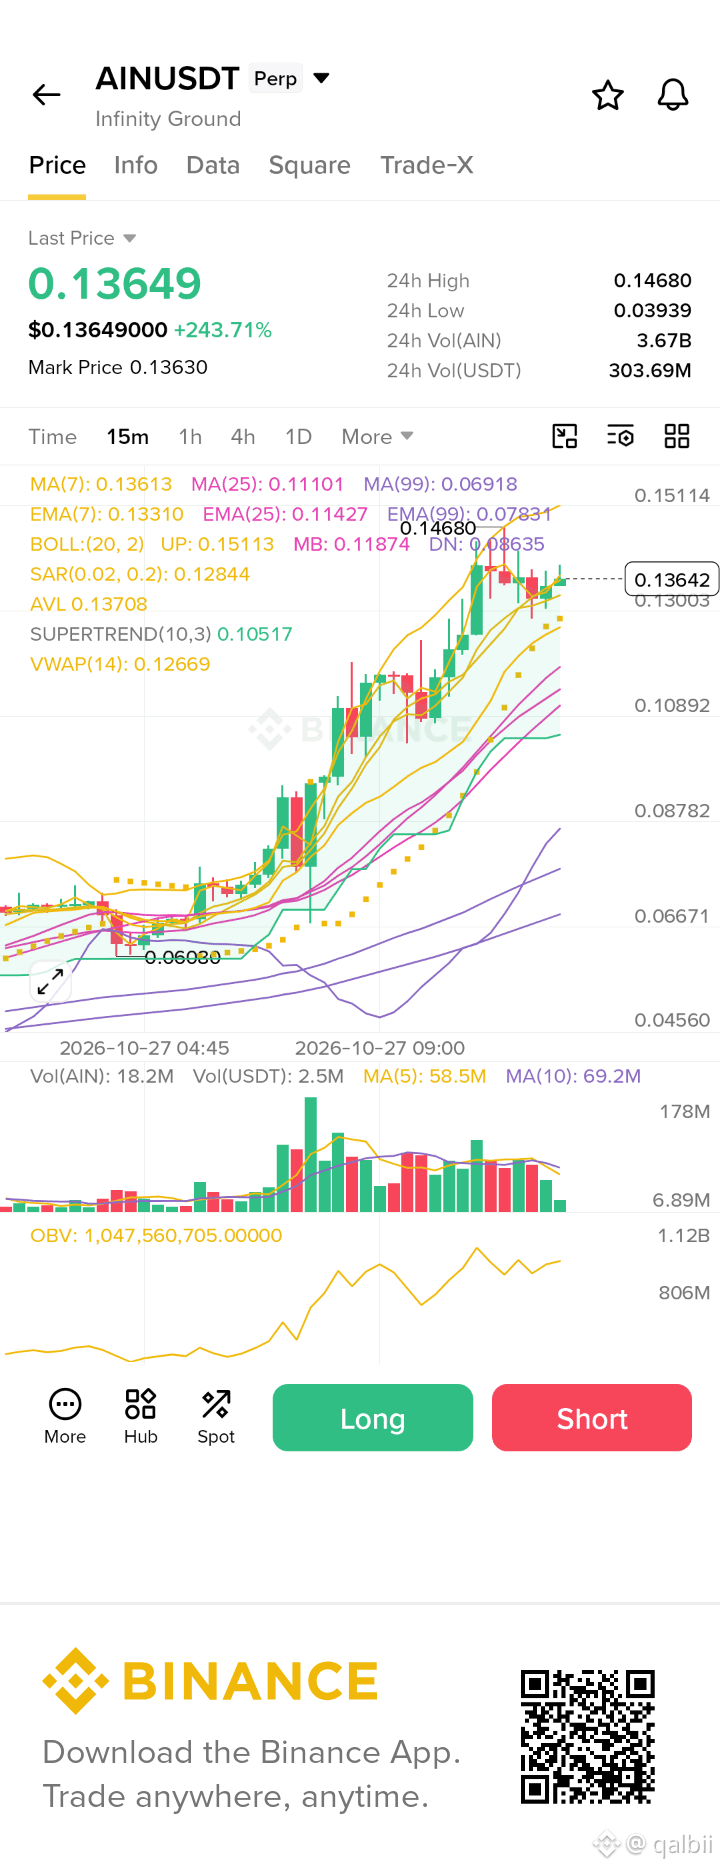
📊 AINUSDT PERPETUAL — 15M TECHNICAL ANALYSIS
🚀 AINUSDT has surged +243.71% in 24 hours!
The chart shows a strong bullish trend, with price trading above the key moving averages. However, after such a sharp rally, volatility and pullback risk remain elevated.
📈 TECHNICAL OVERVIEW
• 24H High: 0.14680
• 24H Low: 0.03939
• MA(7): 0.13613
• MA(25): 0.11101
• EMA(7): 0.13310
• VWAP: 0.12669
• Bollinger Middle Band: 0.11874
• Supertrend: 0.10517
🟢 KEY RESISTANCE ZONES
• 0.1400–0.1468
• 0.1510–0.1550
🔵 KEY SUPPORT ZONES
• 0.1300–0.1280
• 0.1267–0.1230
• 0.1187–0.1140
🎯 POTENTIAL LONG SETUP
Entry zone: 0.1280–0.1320, only if support holds and bullish confirmation appears.
TP1: 0.1400
TP2: 0.1468
TP3: 0.1510
Stop-Loss: Below 0.1260, subject to confirmation and position risk.
🔴 POTENTIAL SHORT SETUP
Do not short simply because the price has pumped.
A short setup becomes more credible if price rejects the 0.1400–0.1468 resistance zone and breaks below 0.1300 with bearish confirmation.
Possible downside levels: 0.1267 → 0.1187 → 0.1110.
⚠️ FINAL DECISION: WAIT FOR CONFIRMATION
AINUSDT remains strongly bullish on the displayed chart, but entering after a +243% rally carries substantial risk. Wait for a confirmed breakout or a clear support failure before opening a position.
These levels are based on the supplied chart snapshot, not verified live market data. Always reassess before placing an order and manage leverage carefully.
#AINUSDT #Binance #CryptoTrading #TechnicalAnalysis #FuturesTrading $AIN $BTC
https://www.binance.com/download?utm_medium=screenshot