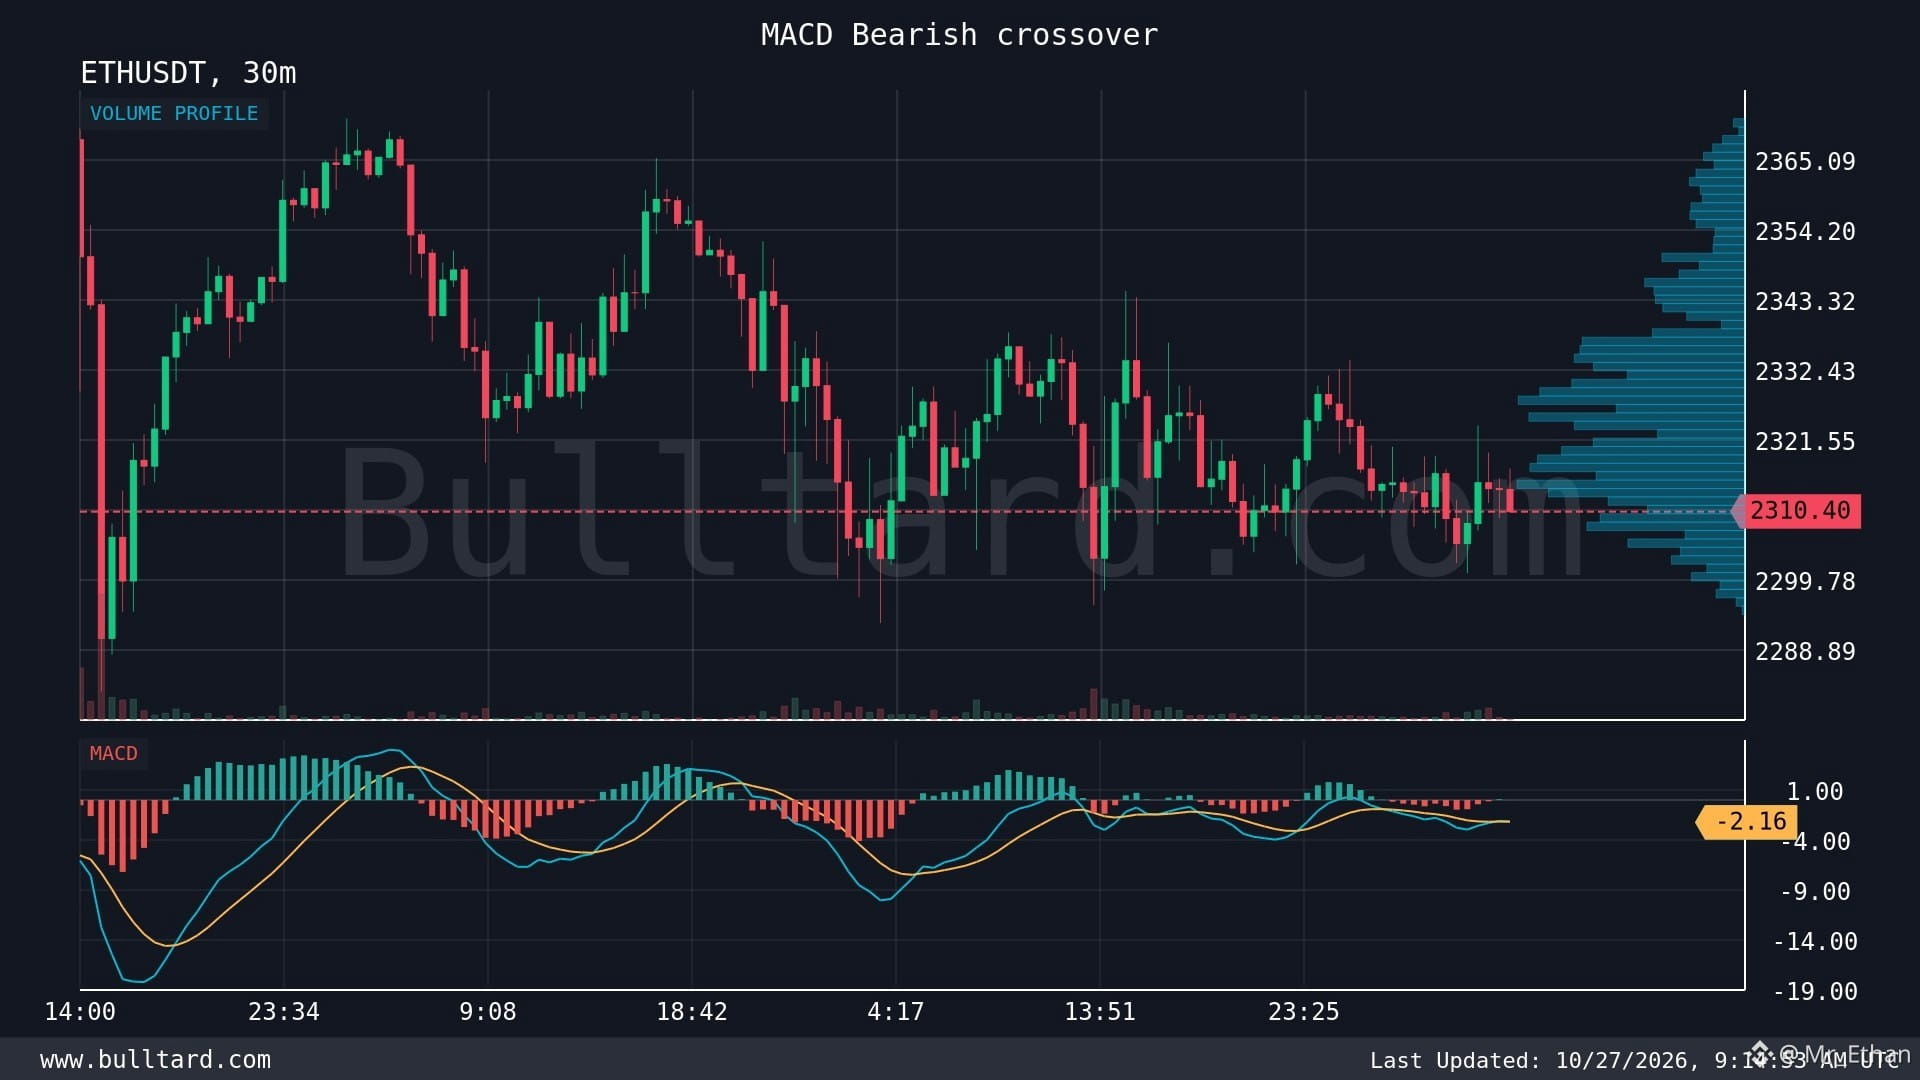

📉 : Bearish MACD Signal on the 30-Minute Chart
I’m keeping a close eye on Ethereum right now. ETH is trading around $2,310.40, and the 30-minute MACD is showing a bearish crossover. It’s a signal I don’t like to ignore.
From my experience, MACD crossovers can help spot a shift in momentum, especially when selling pressure starts building. But I never treat one indicator as a guarantee of where price will go next.
Ethereum still has strong fundamentals. Its smart contract ecosystem, DeFi activity, and growing Layer 2 network make ETH different from many other crypto assets. However, strong fundamentals don’t always protect price during short-term market weakness.
My concern here is whether sellers can maintain pressure below the current price. If bearish momentum builds, ETH could test nearby support levels. On the other hand, if buyers step in and volume increases, this crossover could turn into a false signal.
I’ve learned that chasing every MACD signal can be costly. I prefer waiting for price action and volume confirmation before making a move. Risk management matters more than predicting every candle.
What do you think? Will ETH continue lower, or can buyers push it back up?
$ETH
$BNB