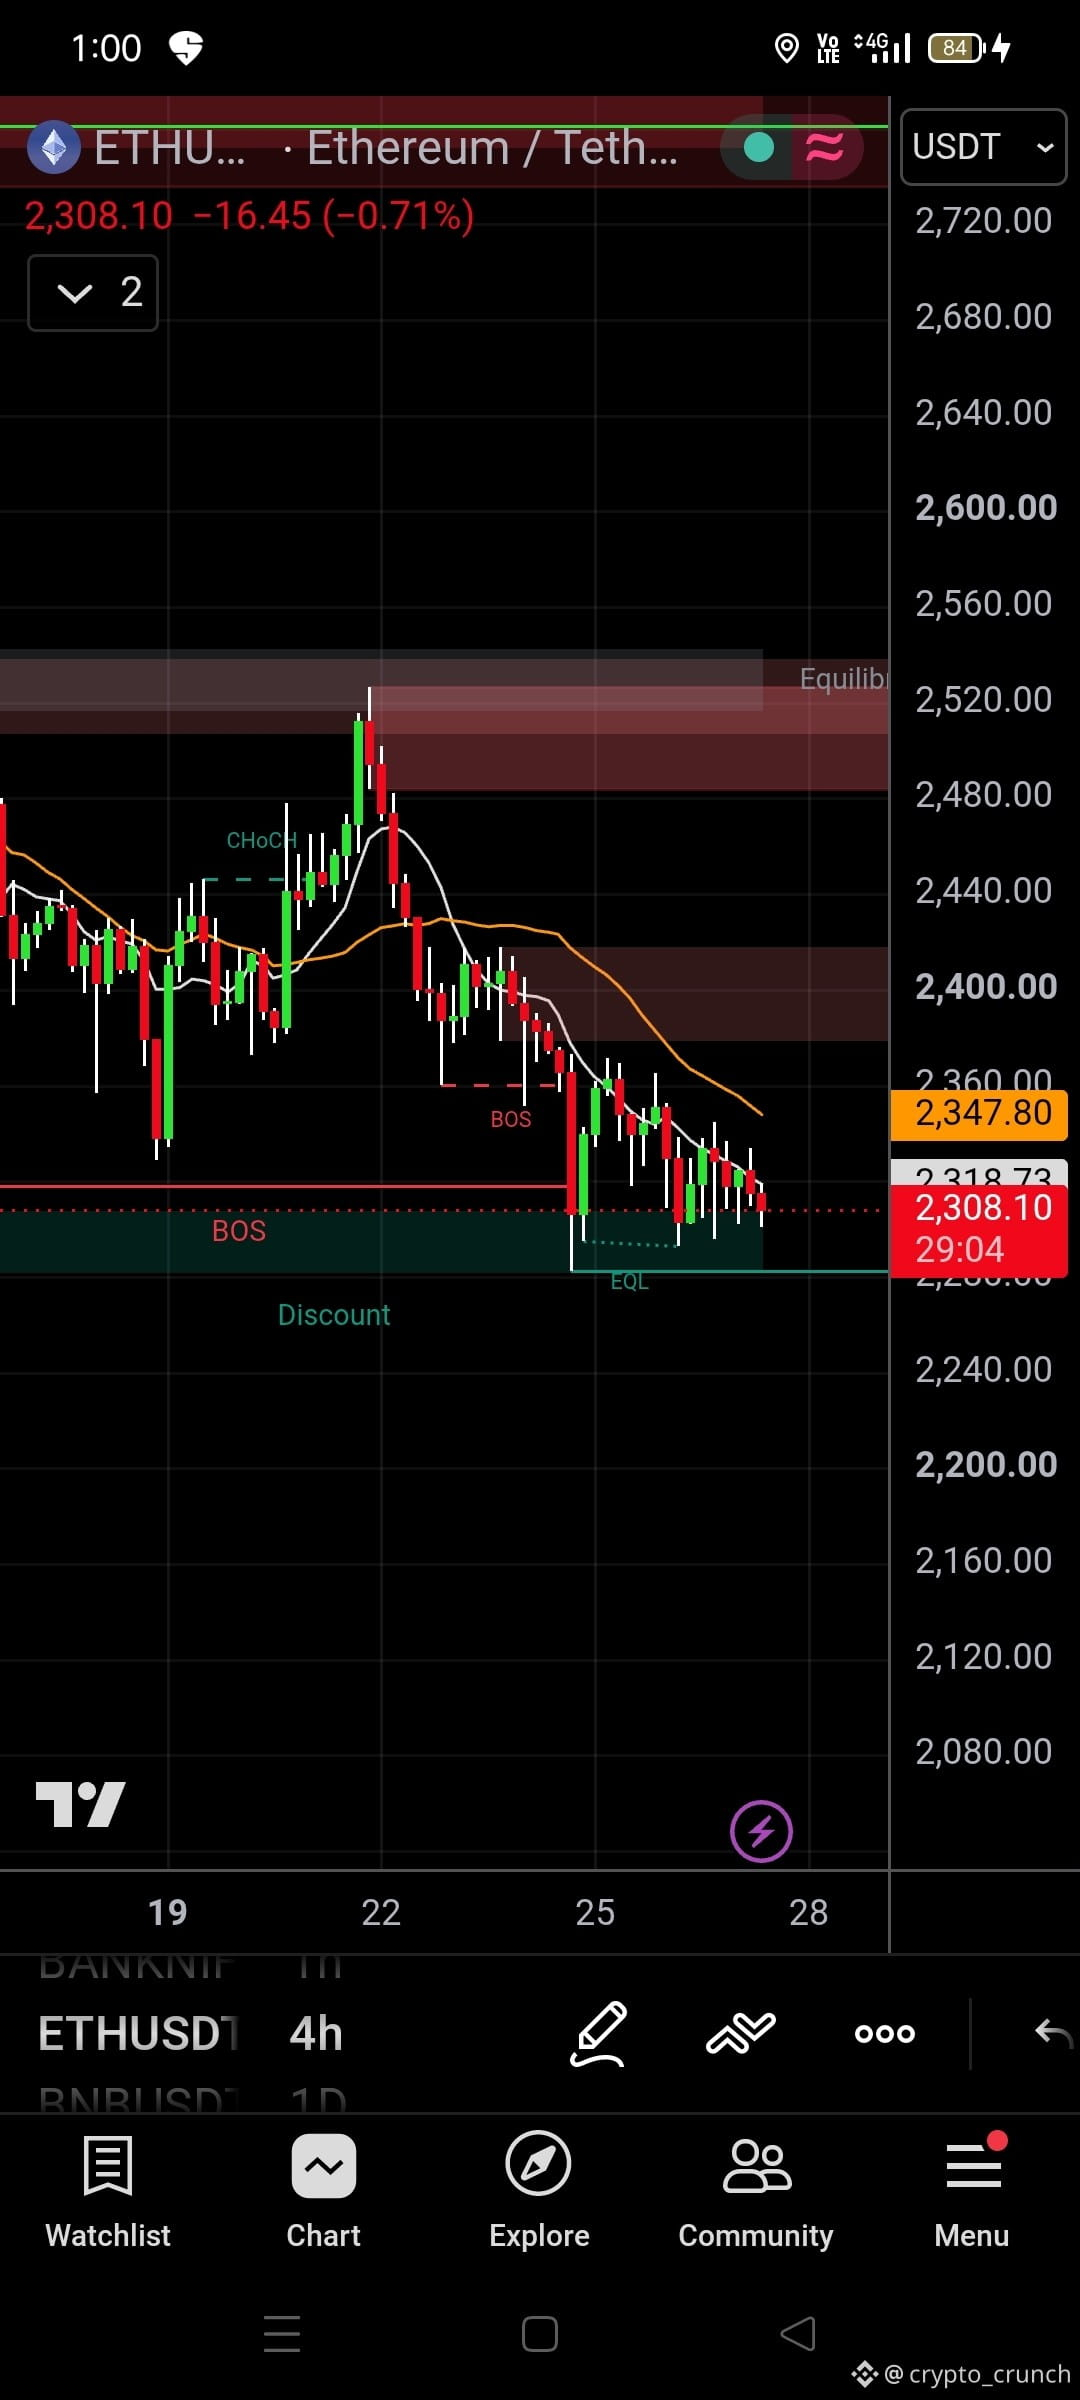
$ETH 4H Chart Analysis 🧠📉
Ethereum is mirroring Bitcoin's weakness. Looking at the 4-hour timeframe, the structure is clearly bearish. Price is currently trading around $2,308 after a significant drop. Here is my technical breakdown:
🔴 Market Structure (MS): We can clearly see a Change of Character (CHoCH) followed by a strong Break of Structure (BOS) to the downside. The trend remains bearish.
📉 Key Zones:
• Resistance: The $2,400 - $2,440 area is acting as a strong supply zone. We also have the Equilibrium level up near $2,520.
• Support: Price is currently testing a local support and is sitting deep in the "Discount" zone. We also have Equal Lows (EQL) near this current price which might act as short-term liquidity.
👀 What to watch?
The price is currently consolidating at the bottom. If it breaks below this EQL support, expect a further drop. However, if we get a short-term relief bounce, the $2,350 - $2,360 area (where the moving average is) could be a great shorting opportunity.
⚠️ Always manage your risk. This is not financial advice.
How low will $ETH go? Let me know your thoughts! 👇
#ETH #Ethereum #CryptoAnalysis #TechnicalAnalysis