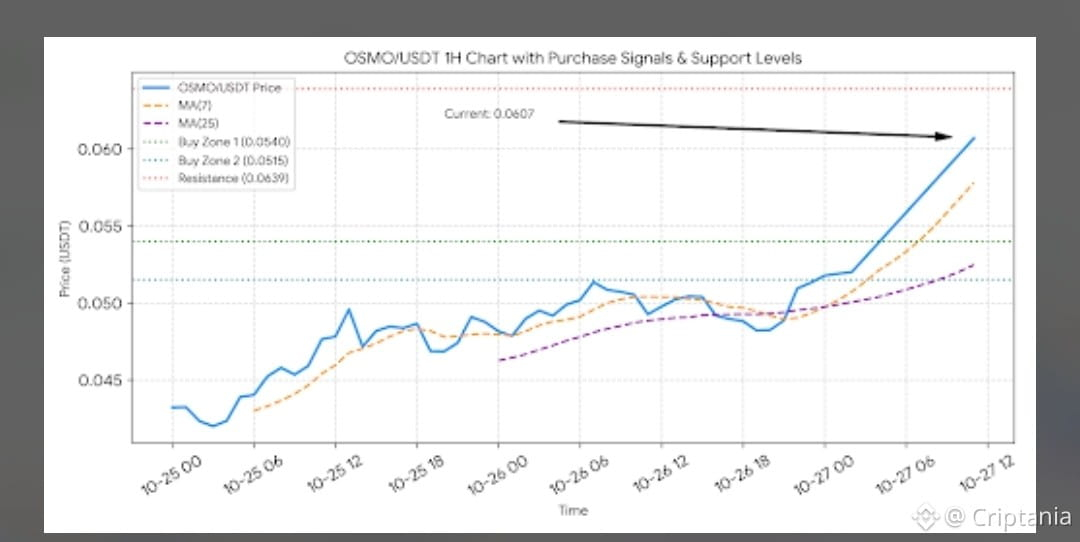
$OSMO OSMO/USDT Technical Analysis (1-Hour Chart)
Current Price: 0.0607 USDT (Rs16.81, up +13.88% on the day)
24h Range: 0.0488 – 0.0639 USDT
Moving Averages: MA(7) is at 0.0540, MA(25) at 0.0520, and MA(99) at 0.0493. The short-term moving averages have crossed bullishly above the long-term averages, confirming a strong near-term uptrend.
Volume: Significant volume spike accompanying the breakout toward the 0.0639 peak, indicating strong buying momentum.
#osmo
❤️ If you find this analysis helpful,
please Follow 🔔 and Like for support