


🥇 Gold Market Analysis Today: XAU/USD Day-Trading Outlook
📅 Date: October 27, 2026
💵 Market: Gold vs. US Dollar (XAU/USD)
🕯️ Timeframe: 15-minute candles
🎯 Focus: Market direction, support and resistance, entry strategies, and risk management.
📊 Gold Market Overview
💰 Recent price reference: Gold was trading around the $4,000–$4,030 region in the latest available market snapshot. This is not a verified live quote.
📈 Bullish outlook: Gold could recover further if buyers defend $4,000 and break above $4,030 with strong momentum.
📉 Bearish outlook: A sustained move below $4,000 could expose lower support near $3,980.
⚖️ Market sentiment: Gold's recovery remains vulnerable to US dollar strength, rising Treasury yields, and uncertainty surrounding Federal Reserve policy.
🎯 Key Support and Resistance
🟢 Resistance: $4,028–$4,030 — Watch for a breakout or rejection.
🟢 Higher resistance: $4,034–$4,040 — Potential upside area if bullish momentum continues.
🟡 Psychological support: $4,000–$4,005 — Monitor whether buyers defend this zone.
🔴 Lower support: $3,978–$3,983 — A potential downside target if selling pressure increases.
⚠️ These are reference levels based on the latest available snapshot, not verified live trading levels. Confirm them on your broker's chart.
🕯️ 15-Minute Candlestick Analysis
📈 Bullish signal: A strong candle closes above resistance, followed by a successful retest.
📉 Bearish signal: A strong candle closes below support, and price fails to reclaim the broken level.
🟢 Bullish rejection: A long lower wick near support, followed by a confirming bullish candle, may indicate buying interest.
🔴 Bearish rejection: A long upper wick near resistance, followed by a confirming bearish candle, may indicate selling pressure.
⚖️ Sideways market: Repeated small candles and frequent moving-average crossovers may indicate consolidation. Avoid chasing price in the middle of a range.
📊 Important: Today's actual 15-minute candles have not been verified here. Use a live XAU/USD chart to confirm current price action.
📈 Technical Indicators
📉 20 EMA and 50 EMA: Price above both averages may indicate bullish momentum; price below both may indicate bearish momentum.
💪 RSI: Above 50 supports bullish momentum, while below 50 supports bearish momentum. Extreme readings do not guarantee reversals.
🔄 MACD: Look for momentum confirmation in the direction of the proposed trade.
📏 ATR: Use volatility to help determine whether your stop-loss distance is appropriate.
🎯 Potential Trading Setups
🟢 Buy breakout: Consider a long setup if gold closes above $4,030 and successfully retests the breakout zone. Look toward the next confirmed resistance for a target.
🔴 Sell breakdown: Consider a short setup if gold closes below $4,000 and fails to reclaim it. Monitor the $3,980 region for potential support.
🟡 Buy support rejection: If price tests $4,000 and forms a confirmed bullish reversal, a long trade may be possible toward nearby resistance.
🔻 Sell resistance rejection: If gold rejects resistance and confirms bearish momentum, consider a short setup toward the next support.
⚠️ These are conditional scenarios, not live trading signals. Do not enter without confirmation.
🌍 Fundamental Factors to Watch
💵 US dollar: A stronger dollar can pressure gold, while a weaker dollar may support it.
🏦 Federal Reserve: Changes in interest-rate expectations can trigger sharp gold-price movements.
📉 Treasury yields: Rising yields can weigh on gold, while falling yields may provide support.
🛢️ Oil prices: Changes in oil prices can influence inflation expectations and gold-market sentiment.
📰 Economic releases: Check the US economic calendar before entering trades, particularly around major announcements.
🛡️ Risk Management
💰 Risk per trade: Consider limiting risk to 0.25%–0.5% of your trading capital while market conditions remain uncertain.
📏 Stop-loss: Place it beyond a technically meaningful invalidation level, accounting for volatility.
🎯 Reward-to-risk: Prefer setups offering a favorable potential reward relative to the amount at risk.
🚫 Avoid overtrading: Do not chase large candles, widen stop-losses impulsively, or increase position size to recover losses.
⏳ Wait for confirmation: Let the 15-minute candle close before acting on a breakout or reversal signal.
🔮 Final Outlook: What Should You Prepare for Next?
Based on the available market snapshot, gold's recovery around $4,000 deserves attention, but the broader decline and interest-rate uncertainty mean that a sustained reversal is not yet established.
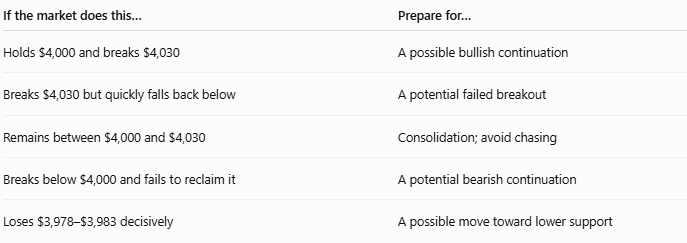
These are conditional scenarios, not predictions that any particular level will be reached.
⭐ My preferred trading approach
I would prioritize a confirmed breakout and retest over trying to predict a reversal at the first touch of support or resistance. This approach helps reduce impulsive entries, although false breakouts remain possible.
The most important task is to confirm the current 15-minute structure before choosing a direction.
⚠️ Data disclaimer: The price levels above are reference zones, not confirmed live prices. Verify current market conditions before placing a trade.
#EarningSession #GoldMarketAnalysis #GoldPricePredictionToday #XAUUSDAnalysis