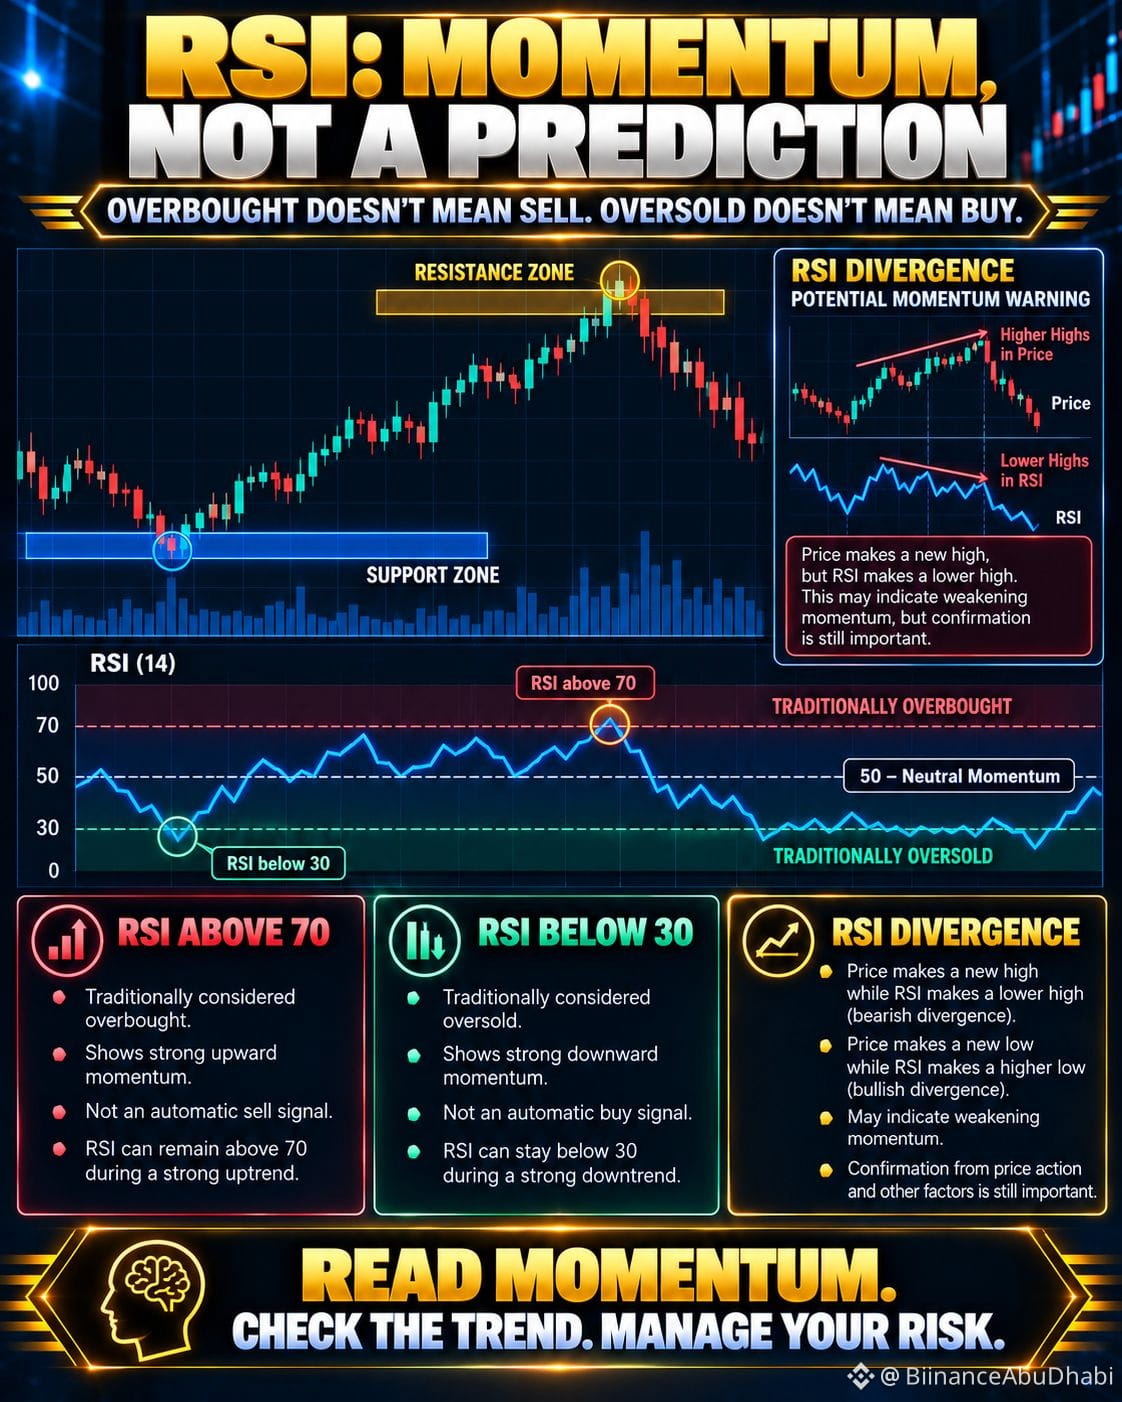
📊 RSI: OVERBOUGHT DOESN'T MEAN SELL. OVERSOLD DOESN'T MEAN BUY.
.
One of the most misunderstood indicators in crypto trading is the Relative Strength Index (RSI).
.
Many traders see RSI above 70 and immediately look for a short. Others see it below 30 and rush to buy the dip.
.
⚠️ But here's the catch: RSI measures momentum, not the market's next destination.
.
🧠 HOW TO READ RSI
.
🔹 RSI above 70 — Traditionally overbought
* Buying momentum has been strong. But in a powerful uptrend, RSI can remain elevated while price continues climbing.
.
🔹 RSI below 30 — Traditionally oversold
* Selling momentum has been strong. But during a strong downtrend, RSI can stay low while price continues falling.
.
🔹 RSI around 50 — A momentum reference
* Holding above 50 can support a bullish momentum interpretation, while staying below 50 may suggest weaker momentum. Always consider the wider chart structure.
.
🔹 RSI divergence — A warning, not a guarantee
* If price makes a new high while RSI makes a lower high, bullish momentum may be weakening. The same principle applies in reverse during declines. Divergence alone does not confirm a reversal.
.
📈 HOW EXPERIENCED TRADERS USE IT
.
Don't isolate RSI from the rest of your analysis.
.
Combine it with:
✅ Support and resistance
✅ Price structure and trend direction
✅ Volume and other relevant indicators
✅ A clear entry plan and risk management
.
💡 THE BIG LESSON
.
An indicator can describe what the market is doing without telling you exactly what it will do next.
.
Use RSI to ask better questions—not to make automatic trading decisions.
.
💬 When analyzing Bitcoin, do you prefer RSI 14, shorter-period RSI for faster signals, or RSI combined with price action? What's your reasoning?
.
#BTC $BTC #BinanceSquare #RelativeStrengthIndex
.
One of the most misunderstood indicators in crypto trading is the Relative Strength Index (RSI).
.
Many traders see RSI above 70 and immediately look for a short. Others see it below 30 and rush to buy the dip.
.
⚠️ But here's the catch: RSI measures momentum, not the market's next destination.
.
🧠 HOW TO READ RSI
.
🔹 RSI above 70 — Traditionally overbought
* Buying momentum has been strong. But in a powerful uptrend, RSI can remain elevated while price continues climbing.
.
🔹 RSI below 30 — Traditionally oversold
* Selling momentum has been strong. But during a strong downtrend, RSI can stay low while price continues falling.
.
🔹 RSI around 50 — A momentum reference
* Holding above 50 can support a bullish momentum interpretation, while staying below 50 may suggest weaker momentum. Always consider the wider chart structure.
.
🔹 RSI divergence — A warning, not a guarantee
* If price makes a new high while RSI makes a lower high, bullish momentum may be weakening. The same principle applies in reverse during declines. Divergence alone does not confirm a reversal.
.
📈 HOW EXPERIENCED TRADERS USE IT
.
Don't isolate RSI from the rest of your analysis.
.
Combine it with:
✅ Support and resistance
✅ Price structure and trend direction
✅ Volume and other relevant indicators
✅ A clear entry plan and risk management
.
💡 THE BIG LESSON
.
An indicator can describe what the market is doing without telling you exactly what it will do next.
.
Use RSI to ask better questions—not to make automatic trading decisions.
.
💬 When analyzing Bitcoin, do you prefer RSI 14, shorter-period RSI for faster signals, or RSI combined with price action? What's your reasoning?
.
#BTC $BTC #BinanceSquare #RelativeStrengthIndex