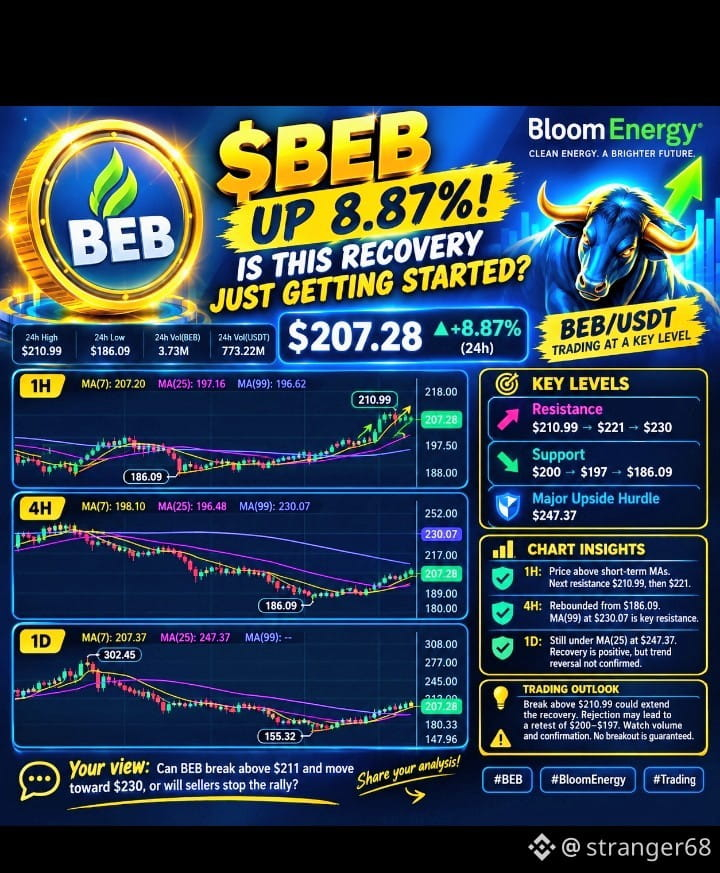
⚡ $BEB — UP 8.87%! IS THIS RECOVERY JUST GETTING STARTED? 🔋
📈 BEB/USDT is bouncing back strongly! Trading at $207.28, BEB has gained 8.87% in 24 hours, with a high of $210.99. After dropping to $186.09, buyers have stepped in—but can they push the price through the next resistance zone? 💹
🔥 1H CHART: The price has climbed above its short-term moving averages. MA(7) is at $207.20, while MA(25) and MA(99) sit near $197.16 and $196.62. The immediate hurdle is $210.99; a breakout could bring $221 into focus. 🎯
📊 4H CHART: BEB has rebounded from $186.09 and moved above MA(7) at $198.10 and MA(25) at $196.48. However, MA(99) near $230.07 remains a major resistance level. Sustained buying pressure is needed to support further upside. 🧭
🗓️ 1D CHART: The bigger picture remains under pressure after the fall from $302.45. Price is near MA(7) at $207.37 but remains below MA(25) at $247.37. This bounce is encouraging, though a confirmed trend reversal is not yet established. ⚠️
🎯 KEY LEVELS TO WATCH
- Resistance: $210.99 → $221 → $230
- Support: $200 → $197 → $186.09
- Major upside hurdle: $247.37
💡 Trading outlook: A strong move above $210.99 could extend the recovery, while rejection may lead to a retest of $200–$197. Watch volume and price confirmation before making a trade. No breakout is guaranteed. 🛡️
❓ Your view: Can BEB break above $211 and move toward $230, or will sellers stop the rally? Share your analysis below! 💬
#BEB #BloomEnergy #Trading
#EarningsSeason #BinancePick #ArgentineCourtDismissesLIBRACaseAgainstMilei #FranklinTempletonFilesForTwoDividendToBitcoinETFs