$TSLA : BIG BREAKOUT OR PULLBACK? 👀
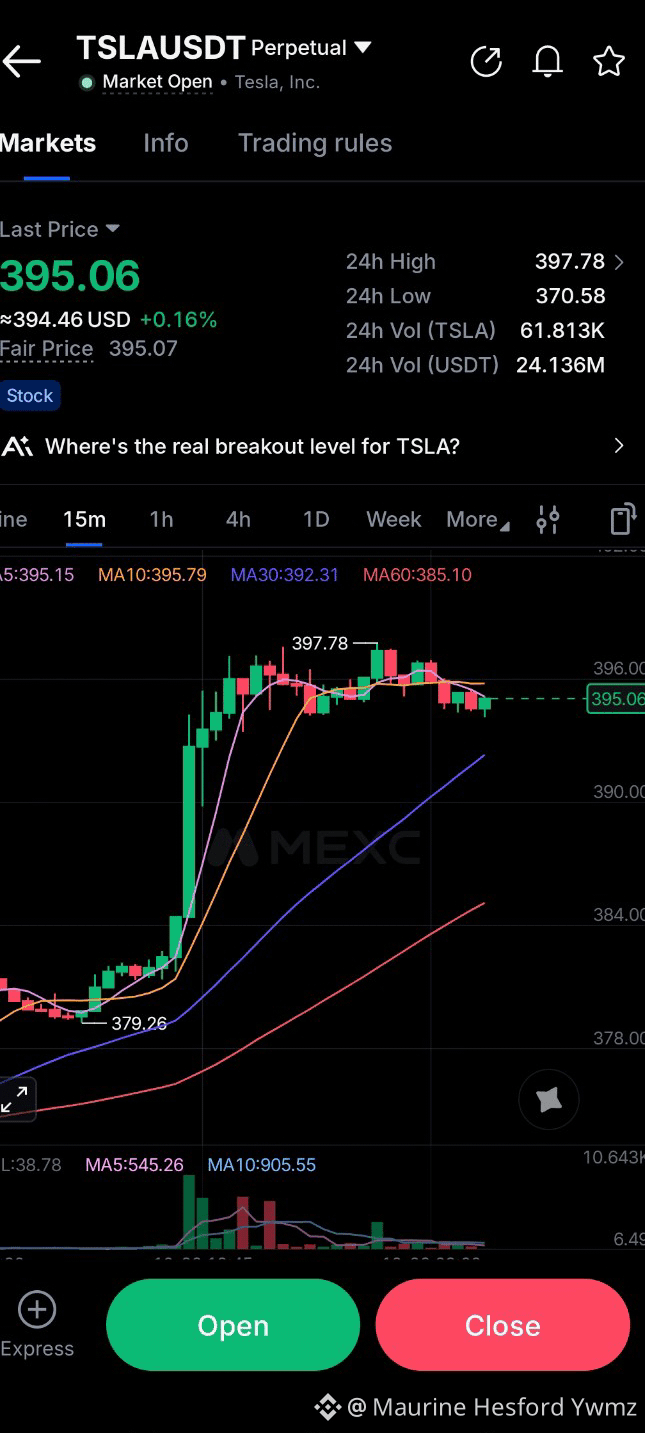
💰 Current Price of $TSLA is $395.06 📈 24H High: $397.78 📉 24H Low: $370.58
🔥 WHAT THE CHART IS TELLING US!
🐂 BULLISH SIGNALS ✅ Strong upward move from $379 to $397 ✅ Price remains above MA30 ($392.31) and MA60 ($385.10) ✅ Bulls could regain control if price breaks above $396–$398 with strong volume.
🐻 BEARISH WARNING ⚠️ Price is consolidating near $395. ⚠️ MA5 ($395.15) and MA10 ($395.79) are above the current price, showing short-term weakness. ⚠️ Losing $392 could trigger a deeper pullback toward $390 or lower.
🎯 KEY LEVELS TO WATCH 🔴 Resistance: $396–$398 🟢 Support: $392–$390 🔥 Major breakout zone: Above $398 with strong volume!
💡 MY TAKE: $TSLA is at a crucial decision point! A confirmed breakout above $398 could signal another bullish move, while rejection near resistance may bring a short-term pullback.
⚠️ Don't chase the pump. Wait for confirmation, manage your risk, and always use a stop-loss.
👇 YOUR TURN, TRADERS! 🚀 BULLISH — Will TSLA break $400? 🐻 BEARISH — Is a correction coming first?
💬 Comment “BULL” 🐂 or “BEAR” 🐻 below!
❤️ Like • 🔁 Share • ➕ Follow for more crypto and market analysis.
#TSLA #TSLAUSDT #TeslaStock #CryptoTrading #TechnicalAnalysis #TradingSignals #BreakoutAlert #BullishOrBearish #DayTrading #Scalping #StockMarket #BinanceTrading #TradingView #PriceAction #CryptoCommunity