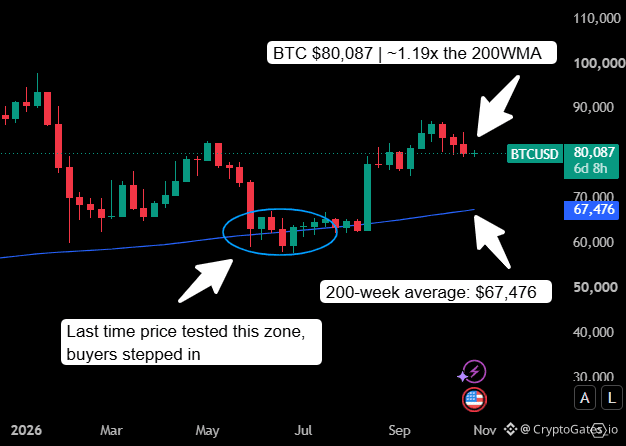
$BTC at $80,087 📊 vs the 200-week average at $67,476
That’s roughly 1.19x above the average on the weekly chart. The last time price came down here (May to Jul), buyers stepped in and price moved higher. That was a test of the level, not a confirmed bottom.
Three scenarios worth mapping:
Price holds above the average and consolidates: structure stays intact
Price drifts back toward it: watch the reaction, not just the level
A clear weekly close below it: the setup changes and risk needs to be reassessed
The 200WMA is a lagging indicator. It gives context, not a signal. Decide your invalidation and position size before price gets there, not after. 🛡️
Verify first. Risk later. Scale slowly...
#BTC #Bitcoin #CryptoAnalysis