

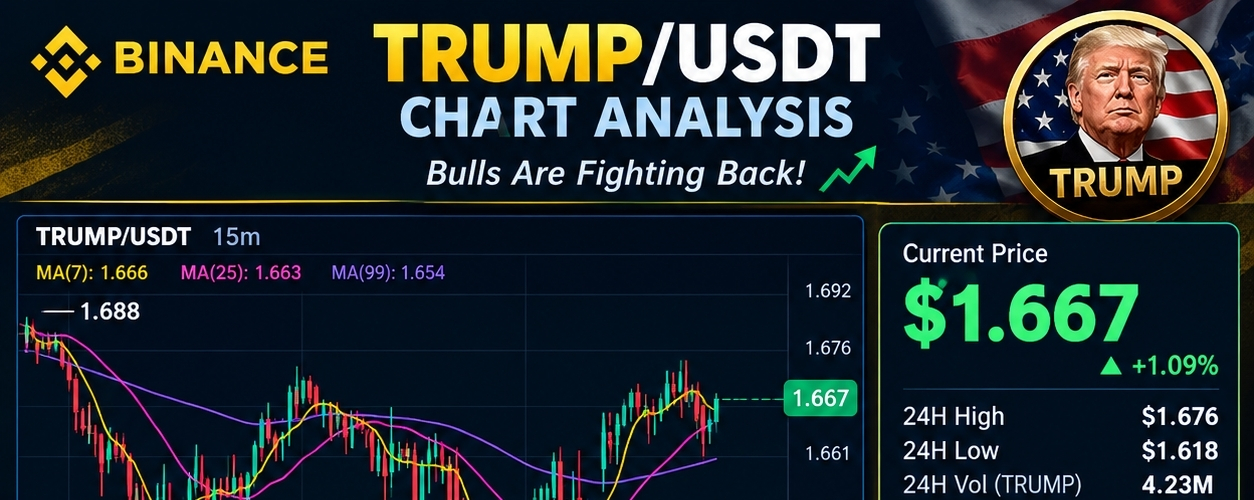

Current Price: $1.667
24H High: $1.676
24H Low: $1.618
24H Change: +1.09%
The TRUMP/USDT chart shows a recovery after a decline toward the $1.618 support area. Buyers have pushed the price higher, and the market is now trading near $1.667.
📊 Key Technical Levels
Resistance: $1.676–$1.688
Support: $1.661, then $1.645
Major Support: $1.618
Technical Outlook: The RSI is around 52.89, suggesting neutral-to-slightly-positive momentum. The price is near the short-term moving averages, so the next move needs confirmation.
Bullish Scenario: A strong breakoutabove $1.676 could open the way toward $1.688, provided buying volume supports the move.
Bearish Scenario: If the price falls below $1.661, it could retest $1.645 or lower support levels.
🎯 Trading Strategy: Avoid chasing the price. Wait for a confirmed breakout or a clear support reaction before considering an entry. Always manage risk and never invest more than you can afford to lose.
*This analysis is based on the provided 15-minute chart and is
