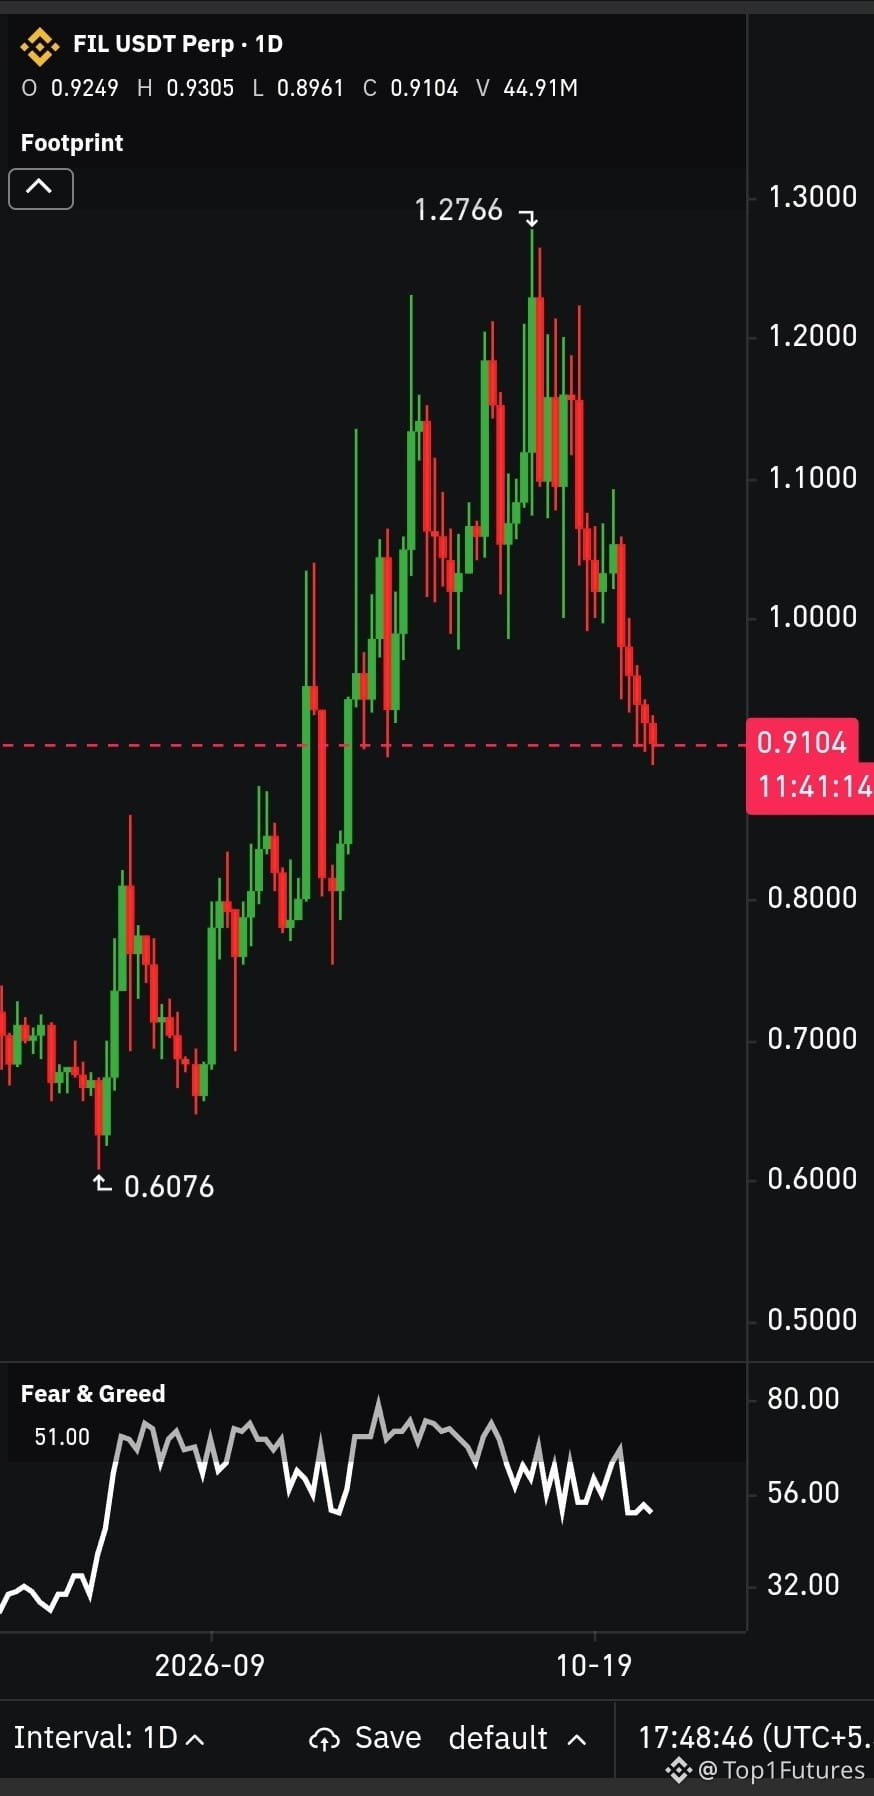
🚨 $FIL on Recovery or Another Major Dump?
On the daily chart, $FIL has dropped to $0.9154 after facing rejection near the $1.20 zone. Price is now trading below all three moving averages: MA(7) at $0.9726, MA(21) at $1.0624, and MA(50) at $1.0038. 📉
RSI(6) is around 23.76, showing heavily oversold short-term momentum. A relief bounce is possible, but buyers still need to prove their strength.
On the 1W chart, $0.85 is an important level to watch, while price remains below the weekly MA(50) near $0.99.
Will $FIL bounce back above $1+, or will sellers push it lower? 👇