$CAP Market Analysis: Bulls Face Crucial Test at 0.12 Resistance After Impressive Rally
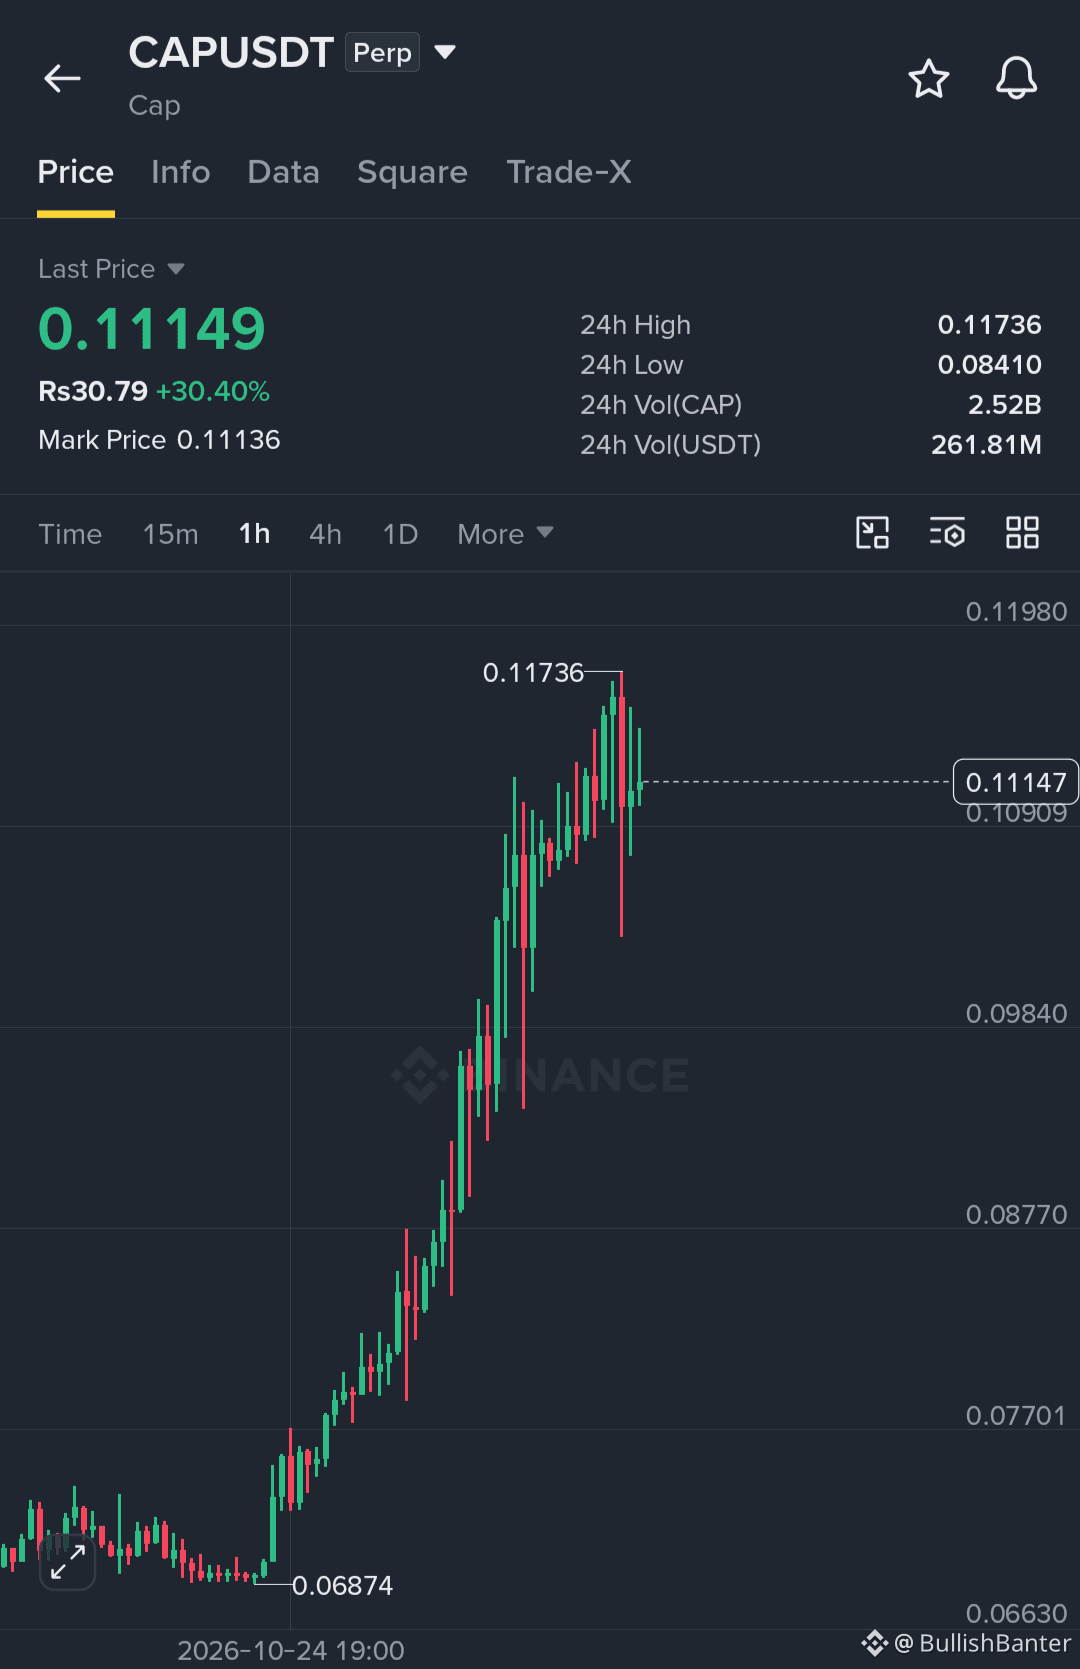
The digital asset $CAP has experienced a significant surge in buying momentum over recent trading sessions, printing a strong rally from its recent swing low of 0.0687 to a local high of 0.1173. This impressive upward move has injected renewed optimism among market participants, demonstrating solid underlying demand at lower price levels.
However, the aggressive bullish momentum is currently facing its first major roadblock. As the price approaches the critical psychological and technical threshold of 0.12, bulls are encountering heavy selling pressure. Take-profit orders and overhead supply are capping further gains for the time being, leaving $CAP struggling to secure a clean foothold above this stubborn resistance zone.
Market Outlook and Potential Scenarios
Technical indicators suggest that the market structure remains inherently strong, but the immediate price action warrants caution. Analysts point to two primary scenarios playing out from here:
The Bearish Pullback Scenario: As long as the 0.12 level holds firmly as resistance, a short-term exhaustion correction is highly likely. If buyers fail to absorb the supply at this level, $CAP could retrace to test lower support regions. Traders should watch the 0.105 area closely, with a deeper extension toward the 0.098 support pocket possible. A healthy correction to these levels would serve to reset overbought indicators and build a more sustainable foundation for the next leg up.
The Bullish Breakout Scenario: Conversely, if the broader market remains supportive and bulls manage to clear the selling pressure, a clean daily close above 0.12 would invalidate the bearish pullback thesis. A decisive breakout above this boundary is expected to trigger short liquidations and FOMO buying, potentially opening the floodgates for another explosive bullish rally toward the next major objective at 0.13 and beyond.
Trading Strategy and Conclusion
While the macro structure for $CAP looks undeniably robust, executing long positions at the absolute peak of a parabolic run carries an unfavorable risk-to-reward ratio. The prevailing advice for disciplined market participants is clear: avoid chasing the pump at these elevated levels.
Instead, patient traders may find better opportunities by either waiting for a confirmed, retested breakout above the 0.12 resistance line or bidding on a structural pullback into the aforementioned 0.105 – 0.098 support zone. Keep a close eye on volume spikes near these key inflection points to gauge the strength of the next market move.
If you want to tailor this further, let me know:
What platform or audience this is for (e.g., a formal blog post, X/Twitter thread, or Discord signal group)?
If you want to add specific technical indicators (like RSI or MACD updates)?
The exact tone you prefer (e.g., highly technical, aggressive, or cautious)?