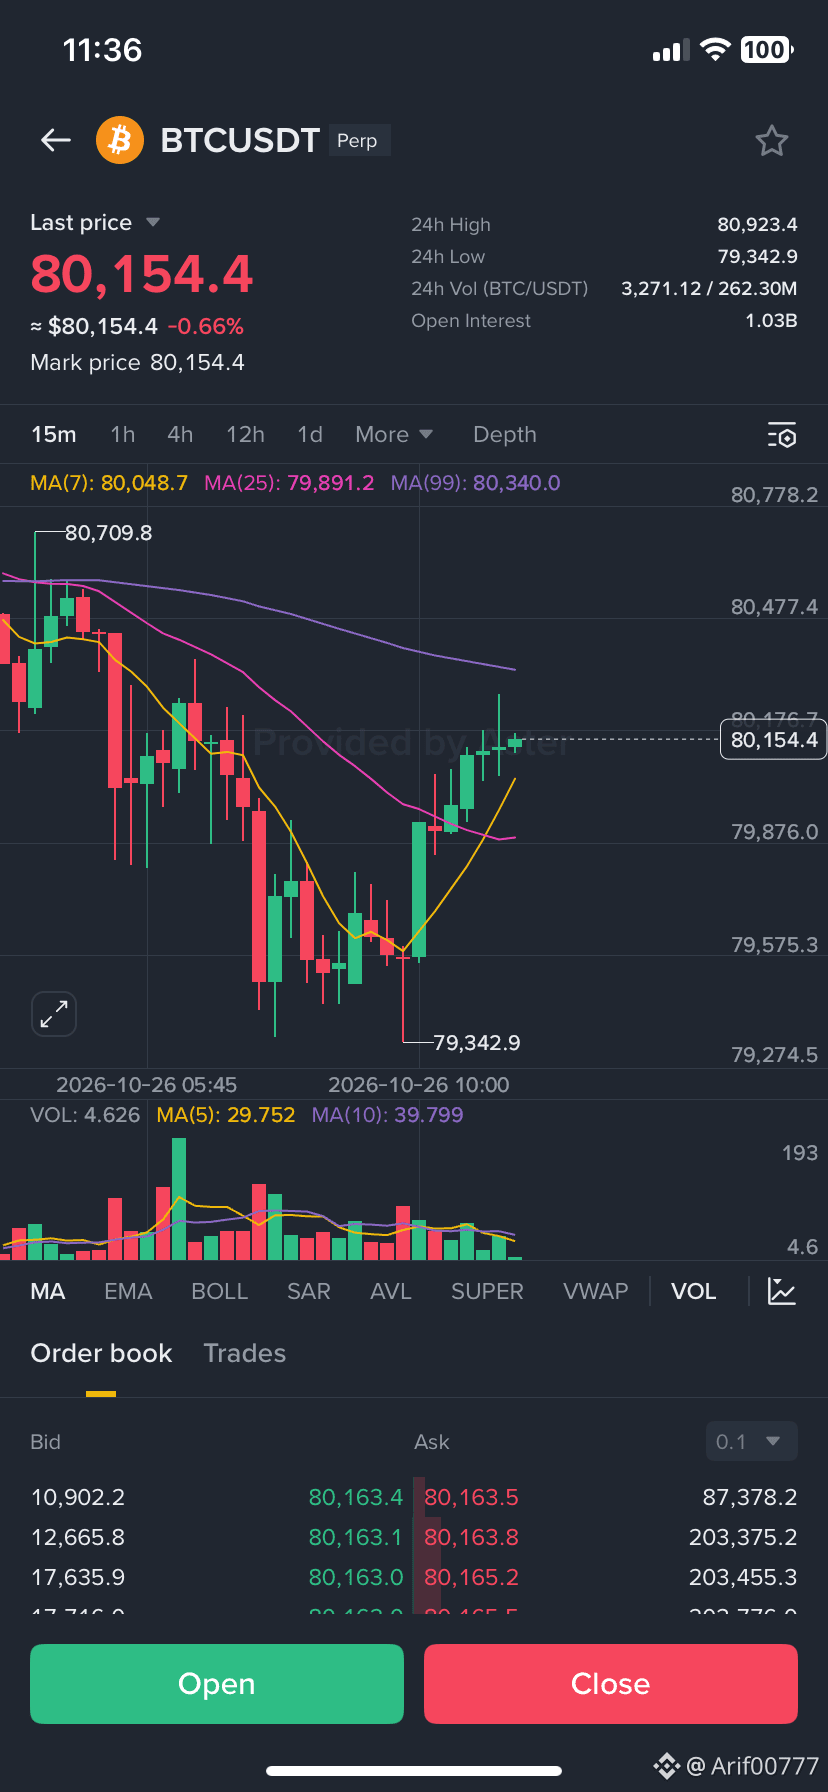
🚀 $BTC /$USDT BUY SIGNAL | Bitcoin Recovery Setup
$BTC is showing signs of a short-term rebound after dropping to $79,342.9. Buyers have pushed the price back above the short-term moving averages, but BTC still needs to overcome nearby resistance before the bullish momentum can be confirmed.
📊 Trading Setup (15M Chart)
🟢 Trading Pair: BTCUSDT Perpetual
📈 Direction: BUY / LONG — Conditional Setup
💰 Current Price: $80,154.4
🎯 Entry Zone: $79,950 – $80,100
✅ TP1: $80,350
✅ TP2: $80,500
✅ TP3: $80,700
🛑 Stop Loss: $79,750
📌 Technical Analysis
• BTC has recovered above MA(7) at $80,048.7 and MA(25) at $79,891.2.
• The $79,875–$79,900 area is a nearby support zone.
• Resistance around $80,340–$80,500 could limit the recovery.
• A strong 15-minute candle close above $80,350, supported by increasing volume, would strengthen the bullish case.
⚠️ Risk Management: This is a chart-based trading idea, not a confirmed signal. Avoid chasing the price if it moves far above the entry zone. If BTC loses support, the setup may fail. Use appropriate leverage and risk only a small portion of your trading capital.
💬 **What do you think? Will BTC break above $80,350 and continue upward, or will sellers push the price back down?
#BTC #Bitcoin #BTCUSDT #CryptoTrading #BuySignal #TechnicalAnalysis #BinanceSquare #DYOR
Disclaimer: This post is for educational purposes only, not financial advice. Always do your own research.