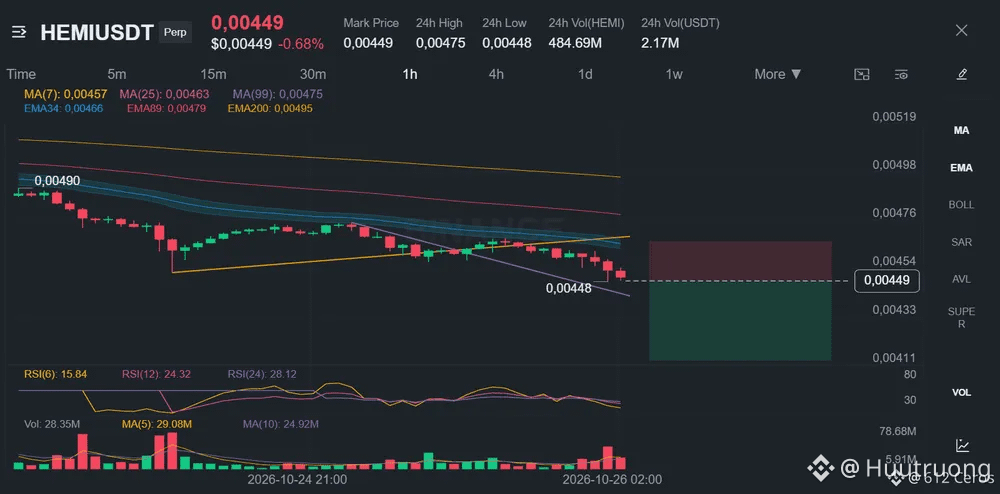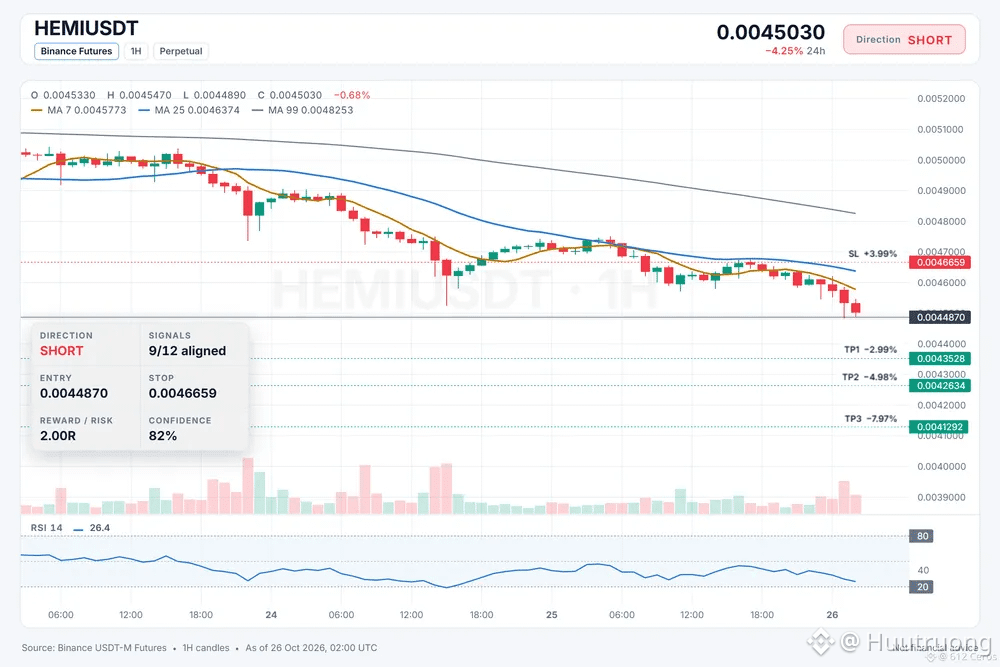
HEMI is grinding lower through a bearish stack across timeframes.
🔴 SHORT $HEMI /USDT: expecting price to go DOWN
Bias: SHORT · Strong
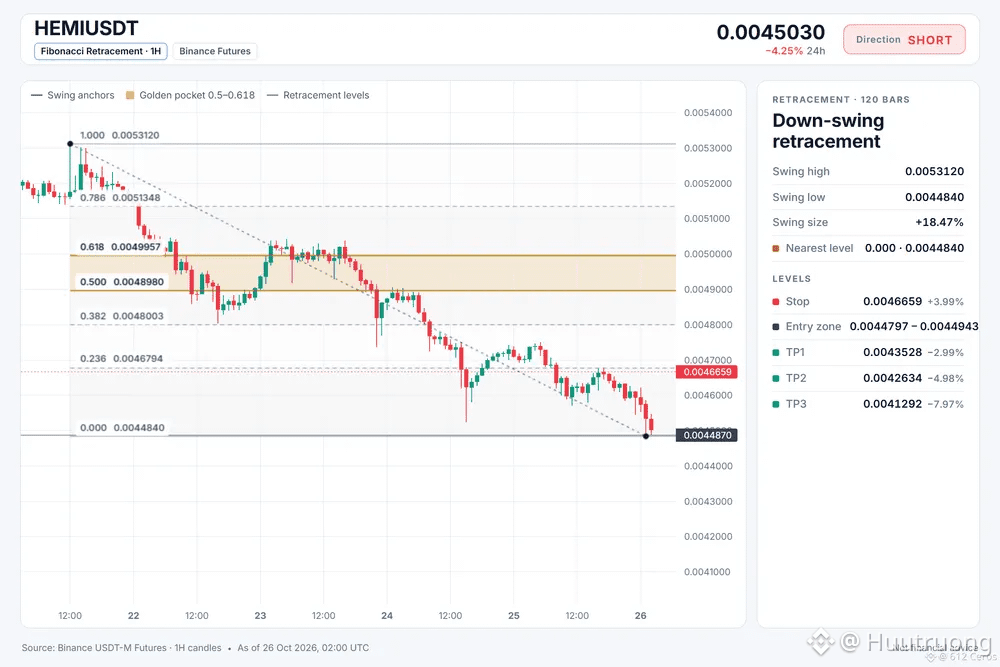
Entry: 0.0044797 – 0.0044943
TP1: 0.0043528 (-3.0%)
TP2: 0.0042634 (-5.0%)
TP3: 0.0041292 (-8.0%)
SL: 0.0046659 (+4.0%)
Plan: enter only inside the zone, close 50% at TP1, 25% at TP2, 25% at TP3, and move the stop to entry after TP1.
Why SHORT? 9/12 signals agree, 1 against.
• Daily trend down (below EMA50 & EMA200)
• 4h trend down (below EMA50 & EMA200)
• 1h trend down (below EMA50 & EMA200)
Risk: Far below its average, bounce likely (−4.2 ATR from 1h EMA50)
Bear path:
If the idea works, price should keep sliding toward the 1h EMA50, confirming the bearish momentum.
What kills it:
A bounce back above the entry invalidates the short and proves the sellers are exhausted.
Where do you see HEMI finding resistance first?