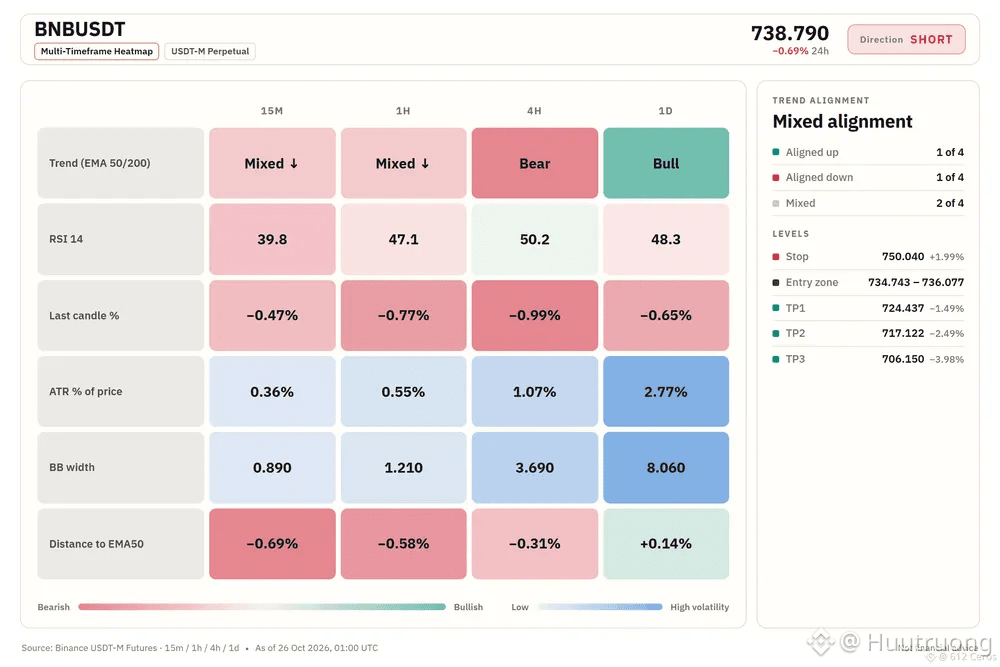
price below both EMAs on the 4h chart
🔴 SHORT $BNB /USDT: expecting price to go DOWN
Bias: SHORT · Leaning
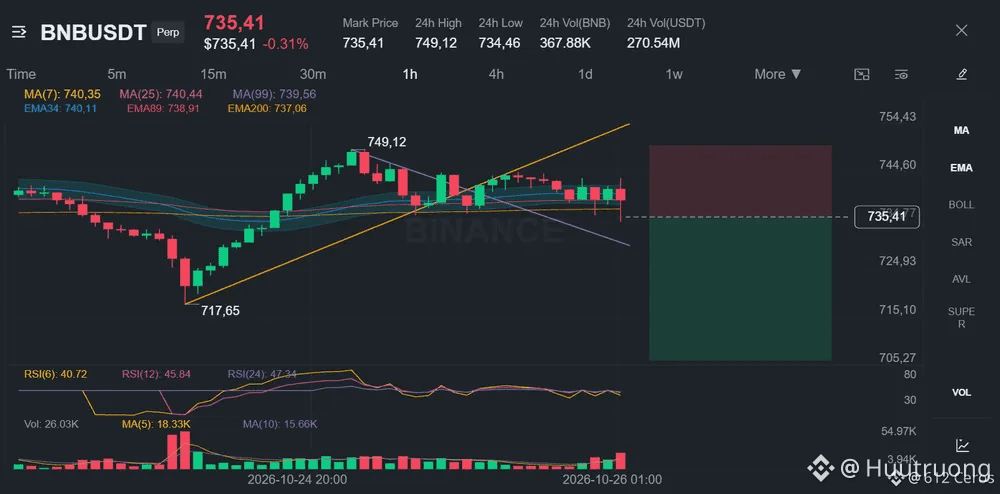
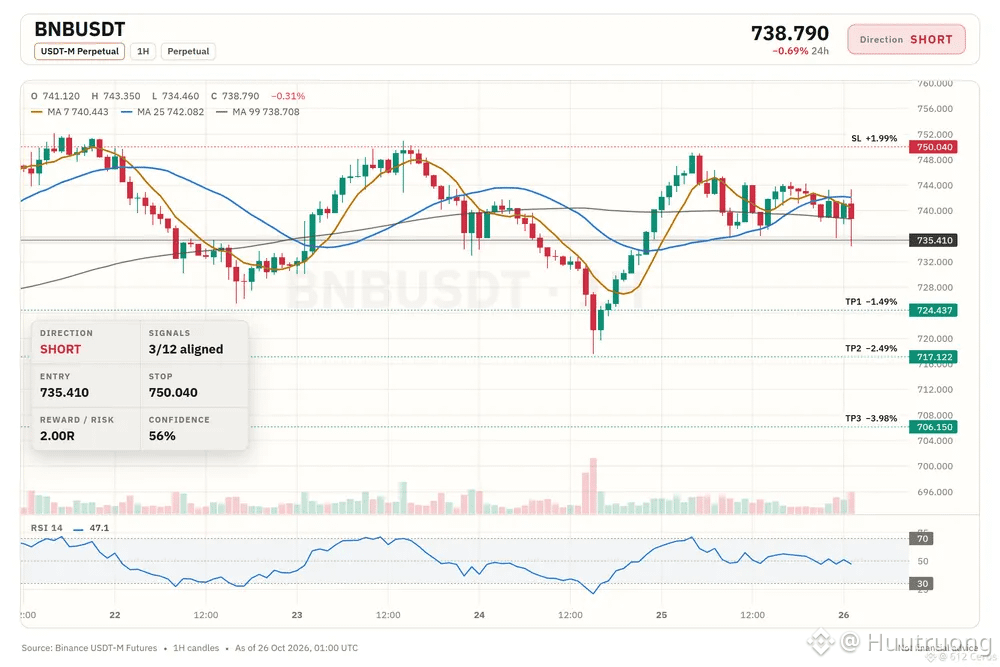
Entry: 734.743 – 736.077
TP1: 724.437 (-1.5%)
TP2: 717.122 (-2.5%)
TP3: 706.150 (-4.0%)
SL: 750.040 (+2.0%)
Plan: enter only inside the zone, close 50% at TP1, 25% at TP2, 25% at TP3, and move the stop to entry after TP1.
Caution: counter-trend idea backed by 3 signals only. Smaller size, hard stop.
Why SHORT? 3/12 signals agree, 1 against.
• 4h trend down (below EMA50 & EMA200)
• is falling, this coin follows (corr 0.90)
• Sellers are pushing right now (−0.47% 15m candle)
Risk: Daily trend up (above EMA50 & EMA200)
Trade note:
I'm watching for a short on because the 4h trend shows price below the EMA50 and EMA200, a bearish stack. The 15m RSI is 39.78, a reading below 50 that means sellers are in control right now. I want to see BNB push from the 1h price of 735.41 toward the daily trend, but the daily trend is bullish, so this is a counter-trend reversal bet and I will size down and respect the stop at 750.040. The strongest support is the 4h bearish stack and the BTC backdrop with a 0.90 correlation showing BTC is falling and BNB tends to follow; the main risk is the bullish daily trend stacking against the setup.
Where do you take profit on this short?