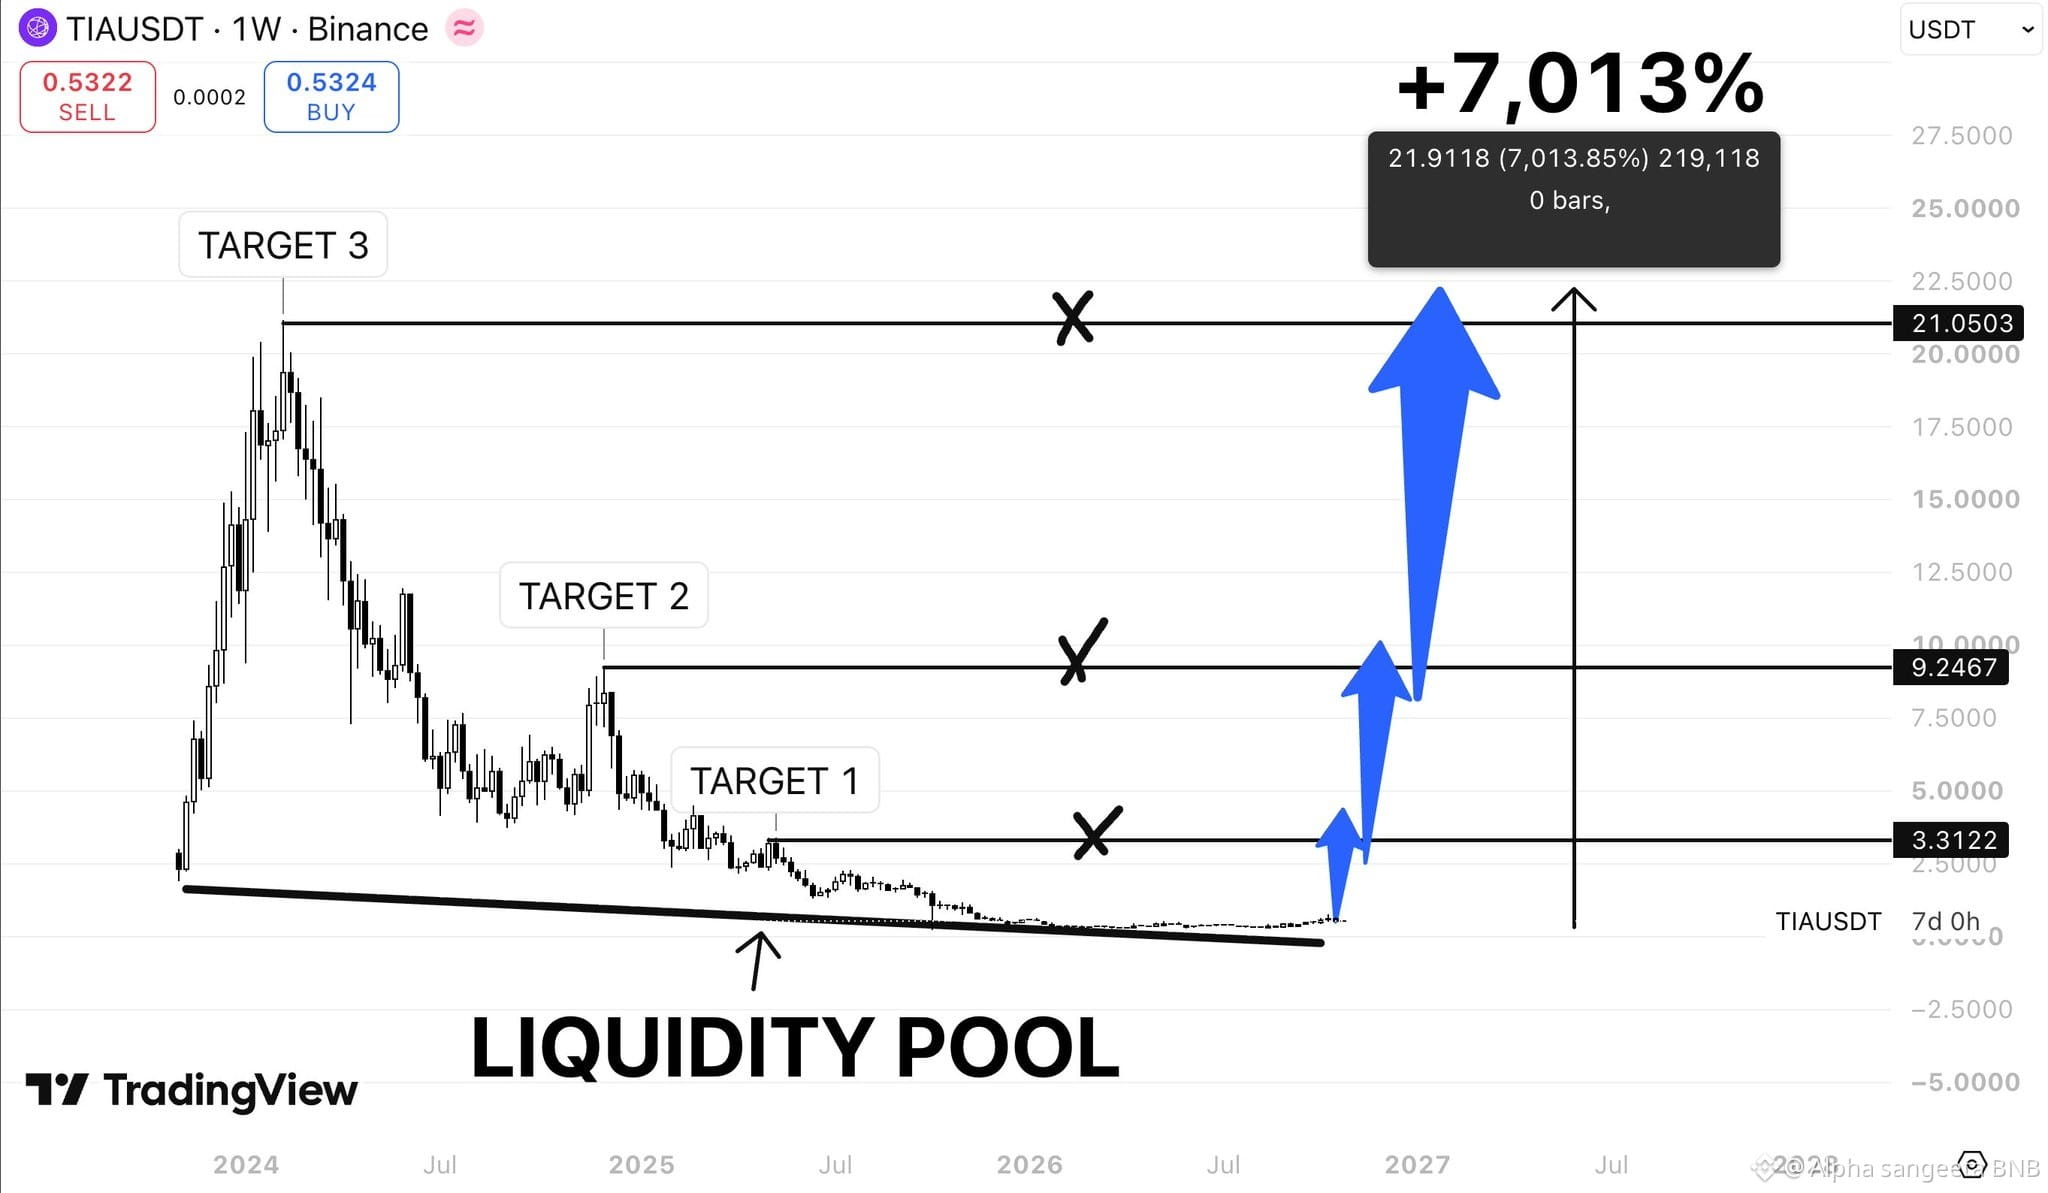
$TIA went from $21 to just $0.53.
A 97% collapse. Almost everyone has given up on it.
But here's what catches my attention.
The weekly chart shows price sitting near a long-term support zone after years of selling pressure.
If this turns into a major reversal, my targets are:
$3.31 → $9.24 → $21.05
The full bullish scenario would mean a potential +7,013% move.
Crazy? Absolutely. Guaranteed? Not even close.
But crypto has a habit of making the most hated charts interesting again.
Would you take a chance on $TIA at these levels?