📈 SCHD: Steady Income or Growth Opportunity?
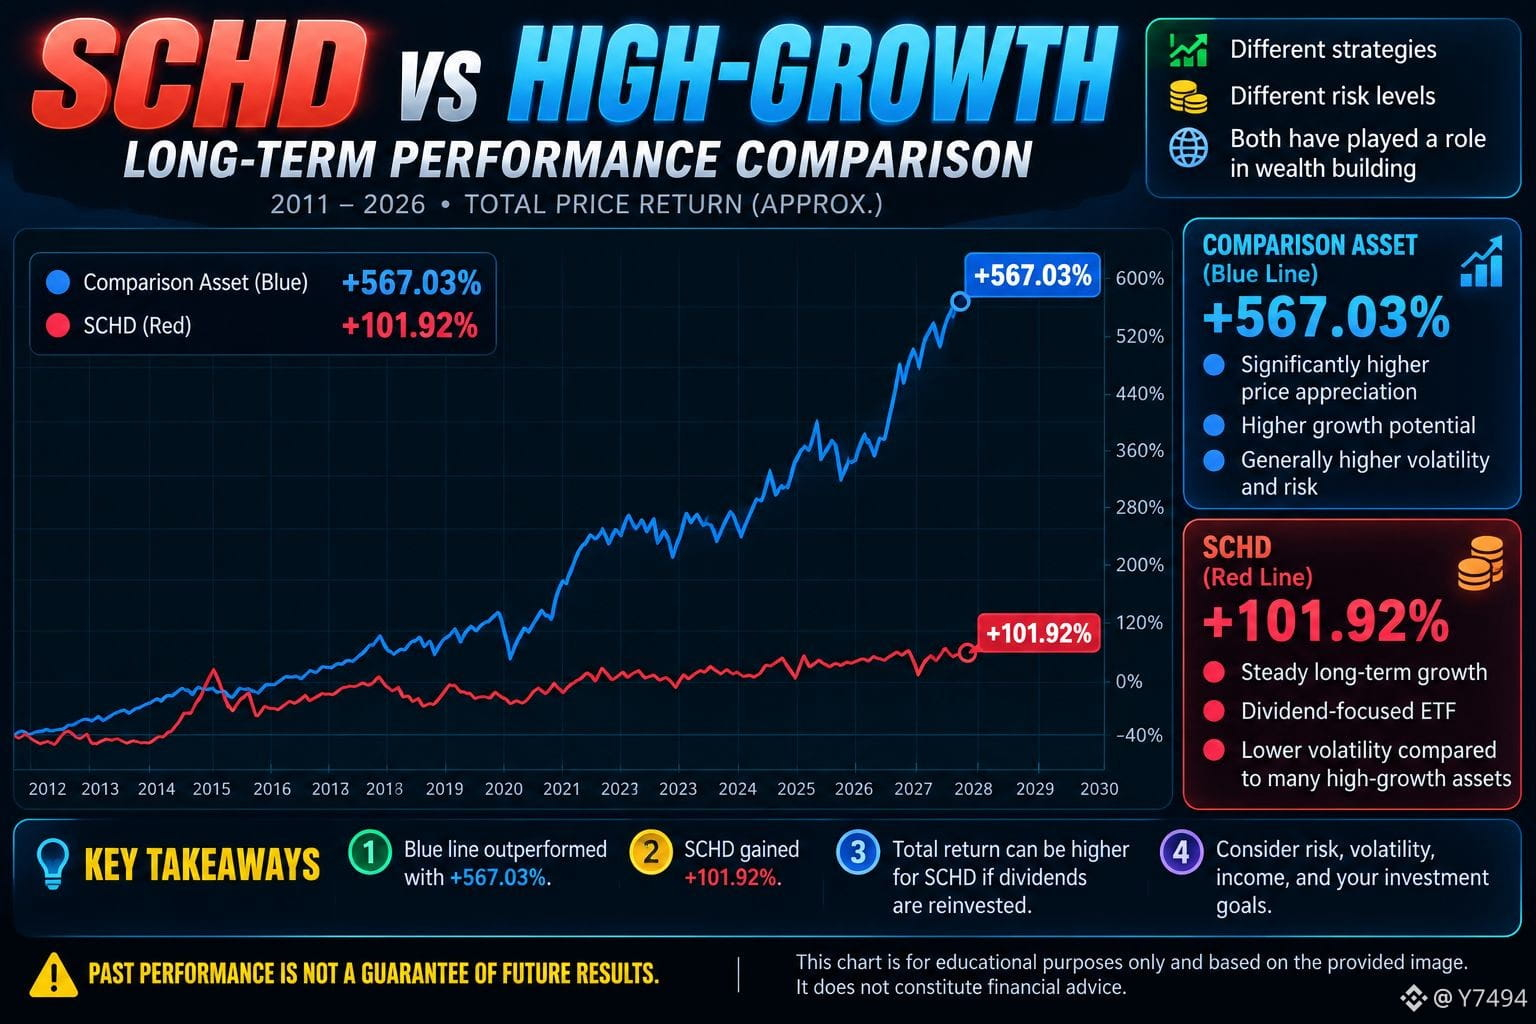
This long-term chart shows SCHD up roughly +101.92%, while the comparison asset in blue gained around +567% over the displayed period.
But raw price performance doesn't tell the whole story. Dividend reinvestment, volatility, and risk can completely change the comparison.
💬 What matters more to you? 🟢 Dividend income 🔵 Long-term growth 🟡 Balanced strategy
#SCHD #ETF #Investing #DividendInvesting #LongTerm
Historical chart comparison. Not financial advice.
#BinancePick