Can $API3 Reclaim Its Legendary $9.762 Peak? 🚀📈
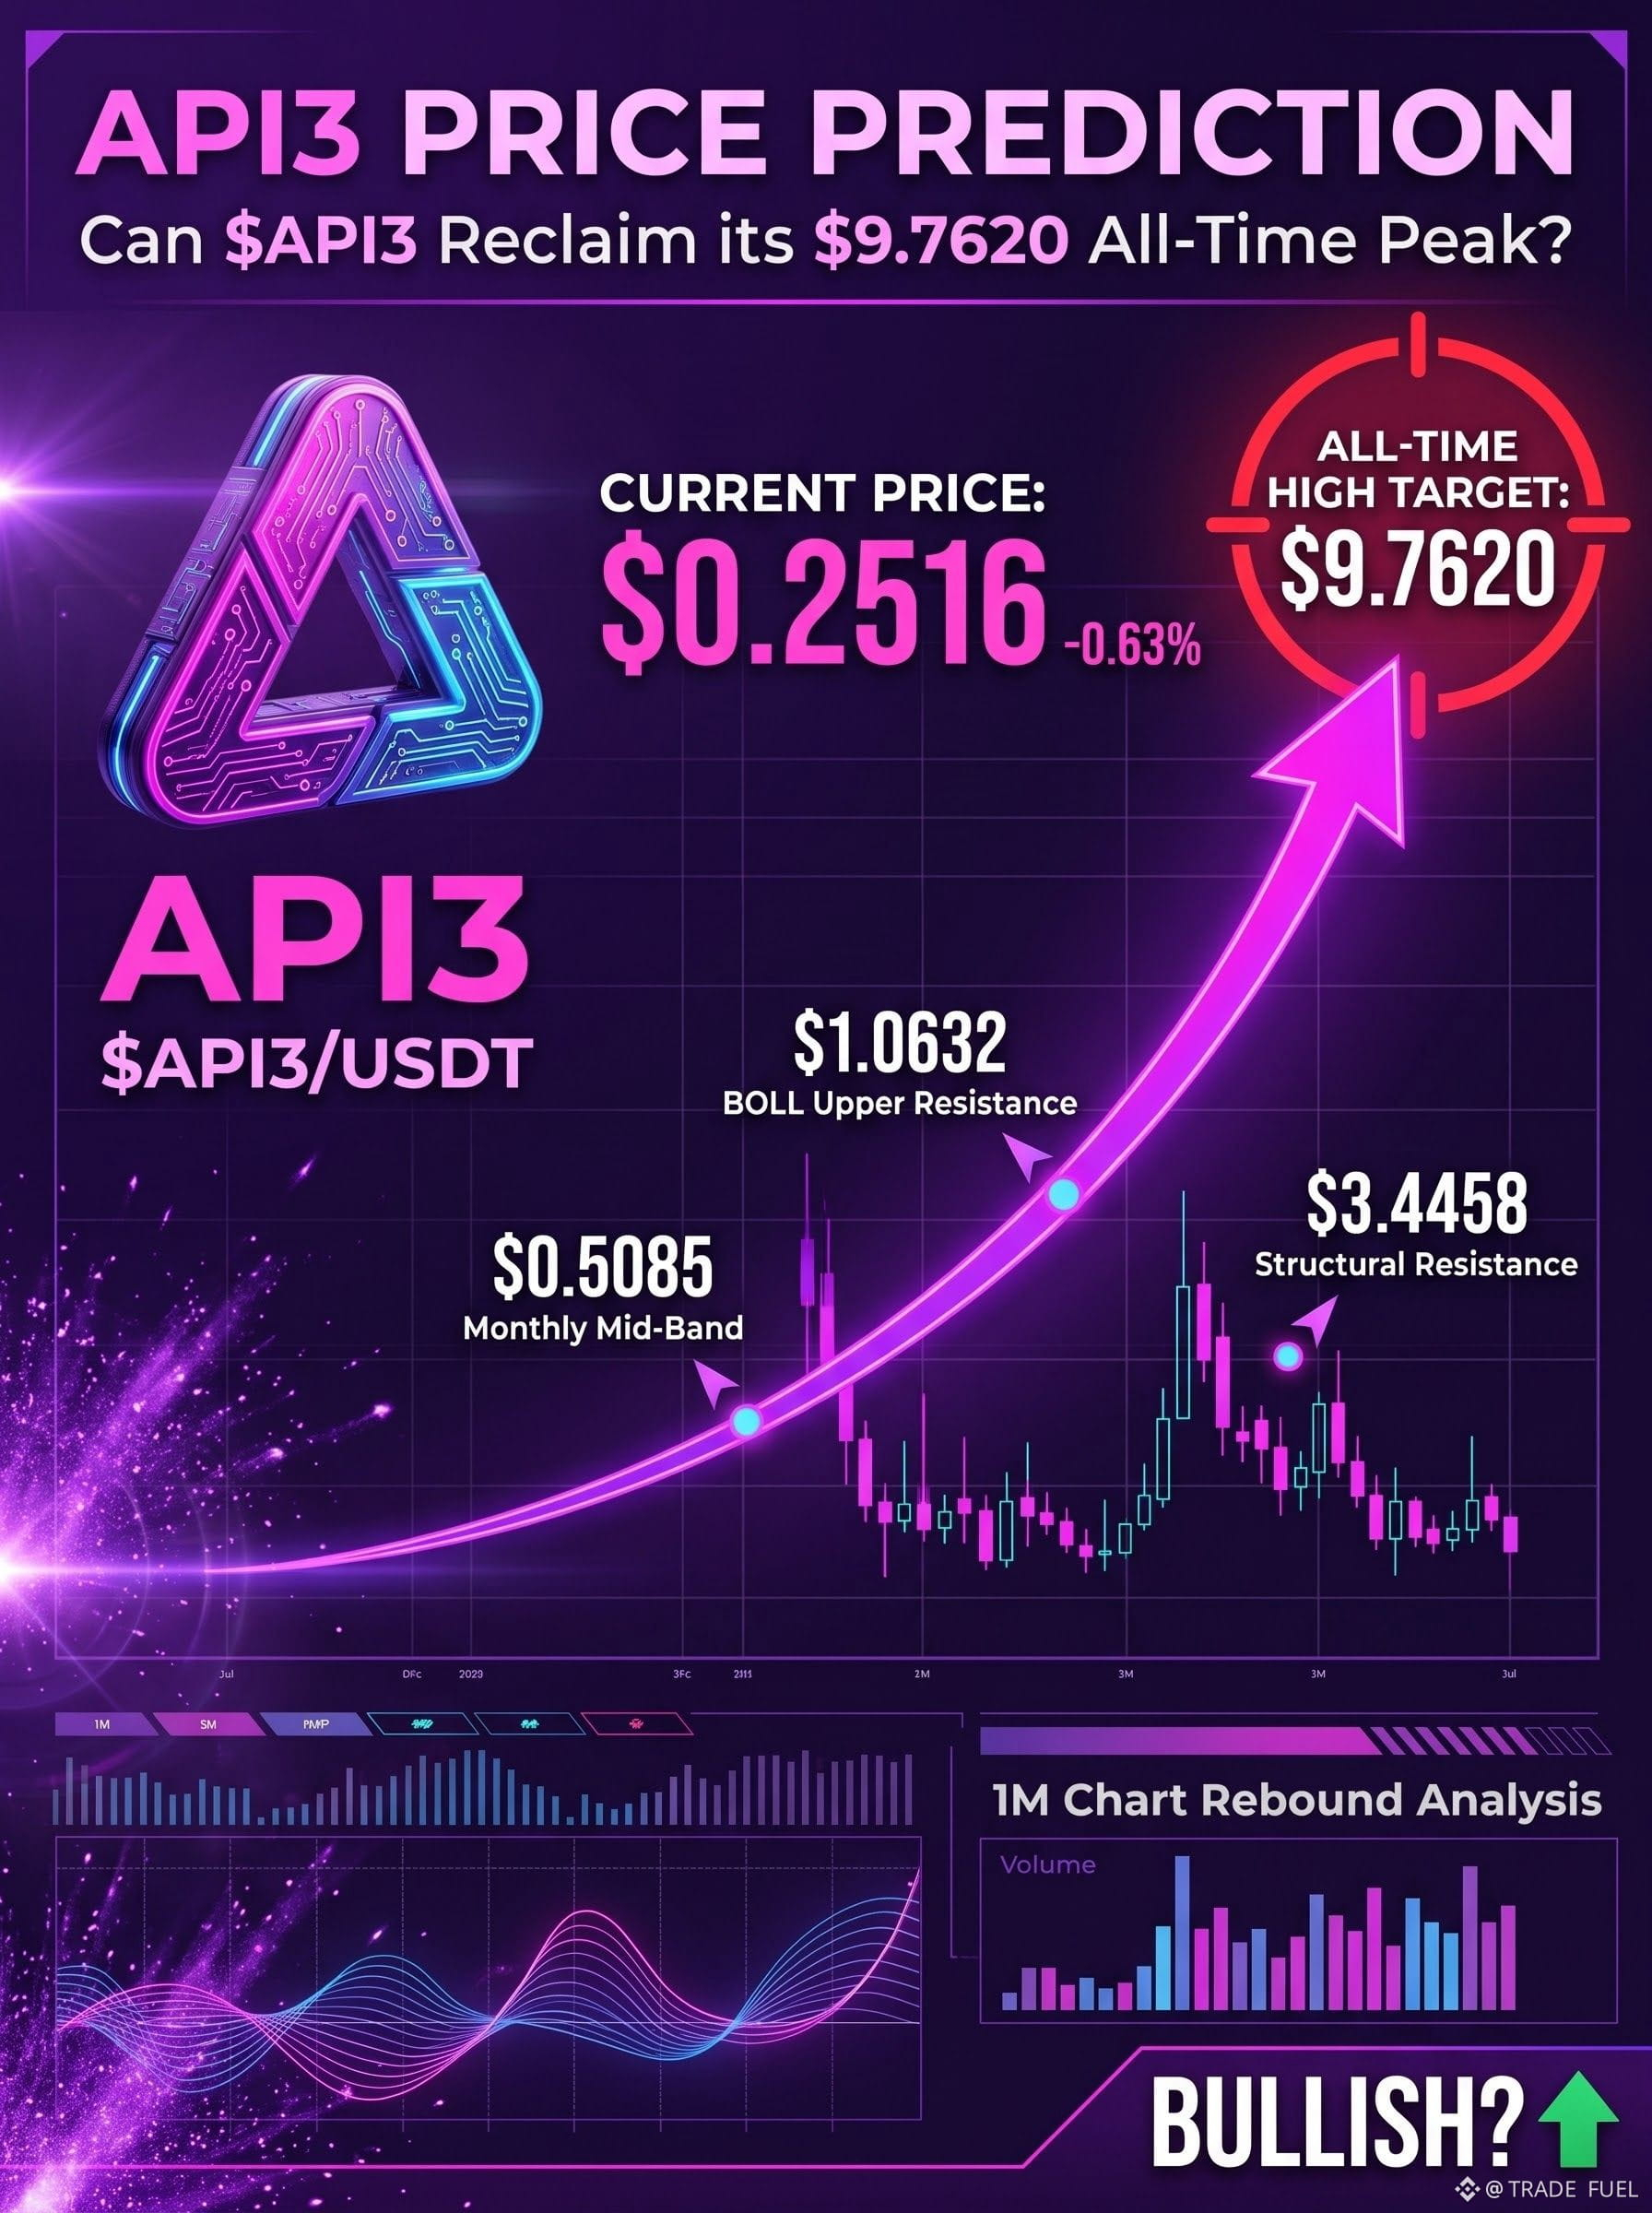
Taking a look at this high-timeframe monthly 1M chart for API3/USDT (image_6.png), the price sits near an all-time low consolidation around $0.2516 (down Rs69.63, -0.63% on the day).
Meanwhile, the highlighted peak at $9.7620 represents the token’s historical bull run summit. A potential run back to this level represents a massive, cycle-defining journey.
Let's break down the technicals and what it would take for API3 to achieve this:
📊 The Numbers: What It Takes to Reach $9.762
Current Price: ~$0.2516
All-Time Peak: ~$9.7620
Required Gain: ~38x (about a +3,780% return)
🚀 The Bull Case: Eyes on $9.762
To mount a generational recovery, API3 will need to conquer several historical key resistance levels:
1️⃣ $0.5085 (The MB Zone): The monthly Bollinger mid-band serves as the first macro pivot. Reclamation here is essential to spark any uptrend.
2️⃣ $1.0632 (BOLL UP): Clearing the monthly Bollinger upper band will shift macro sentiment from bearish to firmly bullish, opening the path for the real double-digit run.
3️⃣ $1.18 - $3.44: Key historical support-turned-resistance regions. Once API3 breaks past $3.44, historical volume gap windows can allow fast movement back to $5.71 and ultimately $7.97 on its way to retesting $9.7620.
💎 Fundamental Support
As a leading "First-Party Oracle" (API3) competing with the likes of Chainlink, its long-term potential hinges on increasing dApp integrations, Web3 infrastructure demand, and massive on-chain data adoption.
🛡️ Major Support to Watch
The macro bottom support is hovering tight at $0.1606. As long as API3 holds above this floor, it maintains the baseline required to accumulate and prepare for its next cycle.
Do you think API3 can capture another 30x+ run in the next major altcoin season? Let us know in the comments below! 👇
(Disclaimer: Cryptocurrencies carry high risk and volatility. This is for educational purposes only and is not financial advice!)
#BinancePick #EarningsSeason $TSLA $META