
$TUSD Price Analysis: Is Another Move Down Coming?
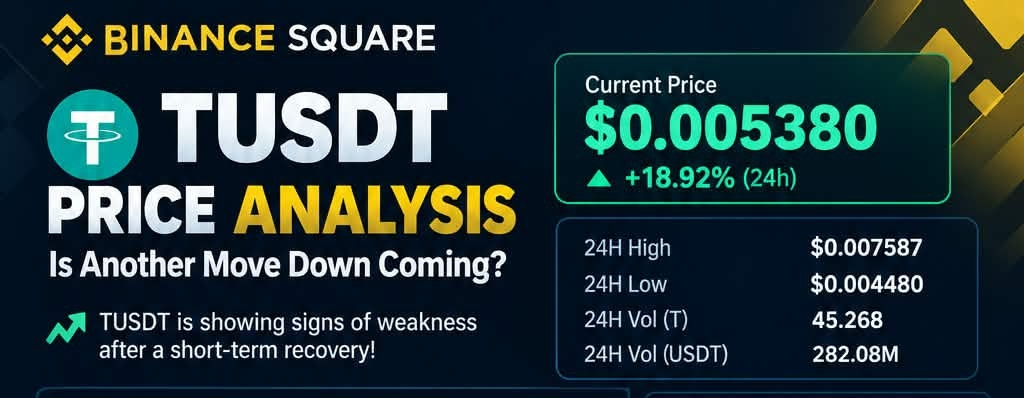
🔥 $TUSD is signs of weakness after a short-term recovery!
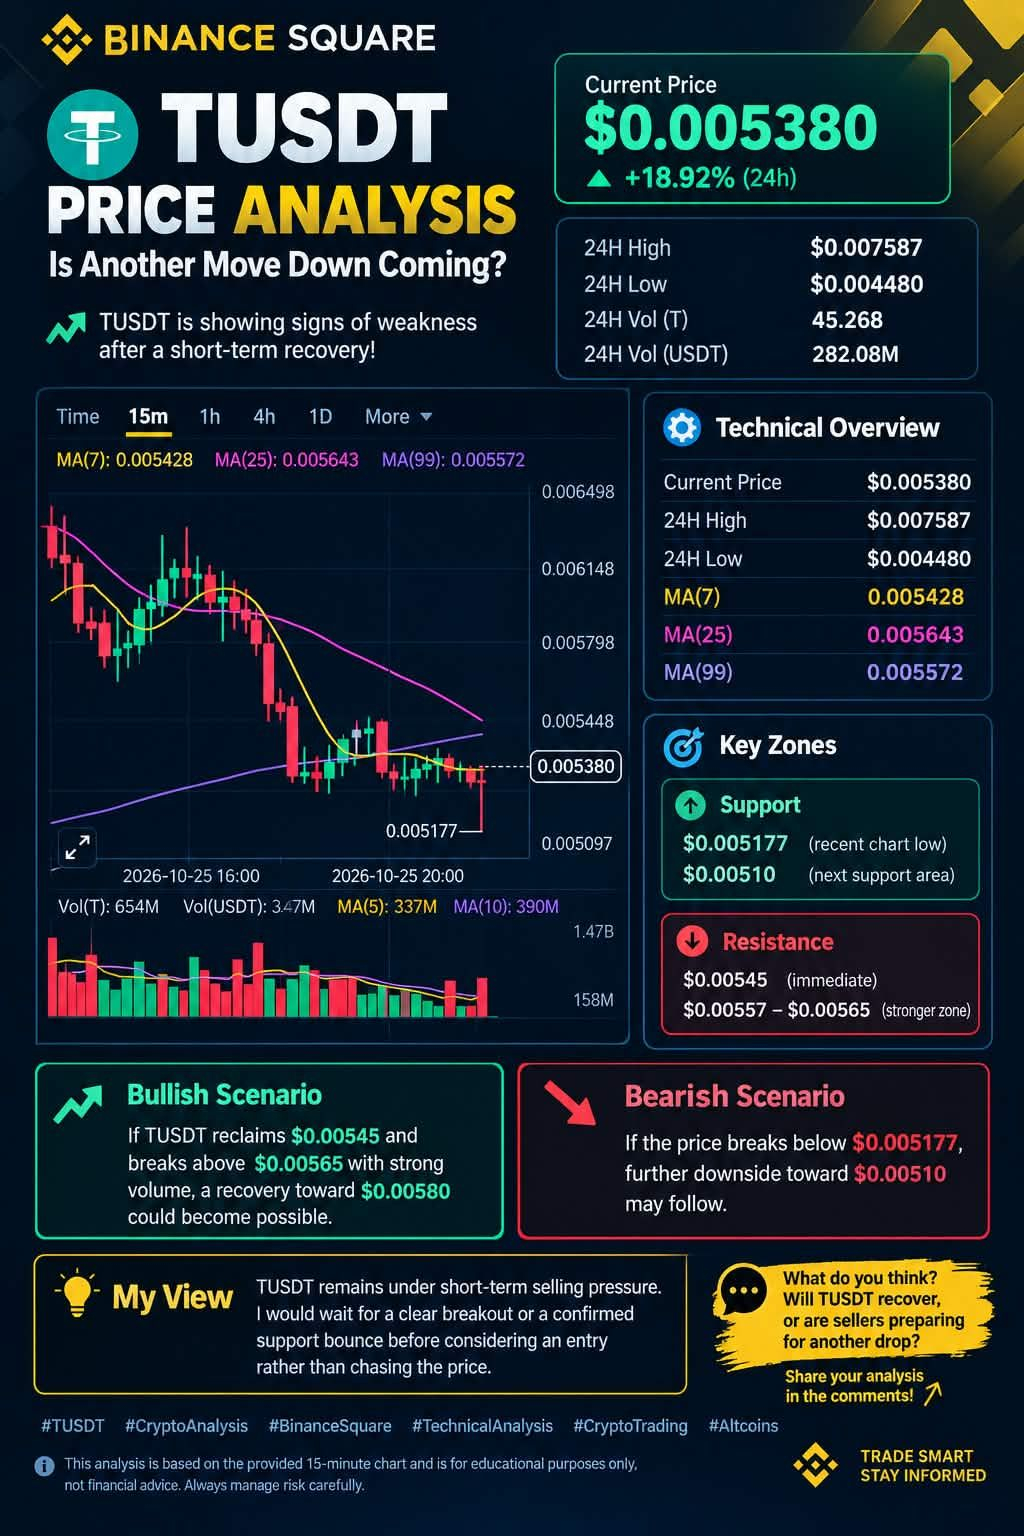
According to the chart, $TUSD is trading around $0.00538, up approximately 18.92% over the last 24 hours. However, the 15-minute chart shows that sellers are still putting pressure on the price.
📊 Technical Overview
💰 Current Price: $0.00538
📈 24H High: $0.007587
📉 24H Low: $0.004480
🔻 MA(7): 0.005428
🔻 MA(25): 0.005643
🔻 MA(99): 0.005572
🔍 What Does the Chart Tell Us?
The price is trading below all three moving averages, suggesting that short-term bearish pressure remains in place. Recent candles also show weak consolidation after a sharp decline.
Key Support Zones
$0.005177 — recent chart low
$0.00510 — potential next support area
Key Resistance Zones
$0.00545 — immediate resistance
$0.00557–$0.00565 — stronger resistance zone
🚀 Bullish Scenario: If $TUSDT reclaims $0.00545 and breaks above $0.00565 with strong volume, a recovery toward $0.00580 could become possible.
⚠️ Bearish Scenario: If the price breaks below $0.005177, further downside toward $0.00510 may follow.
🎯 My View: $TUSD remains under short-term selling pressure. I would wait for a clear breakout or a confirmed support bounce before considering an entry rather than chasing the price.
💬 What do you think? Will $T recover, or are sellers preparing for another drop?
Share your analysis in the comments! 👇#CryptoAnalysis #EarningsSeason #BinancePick #TechnicalAnalysis #CryptoTrading