

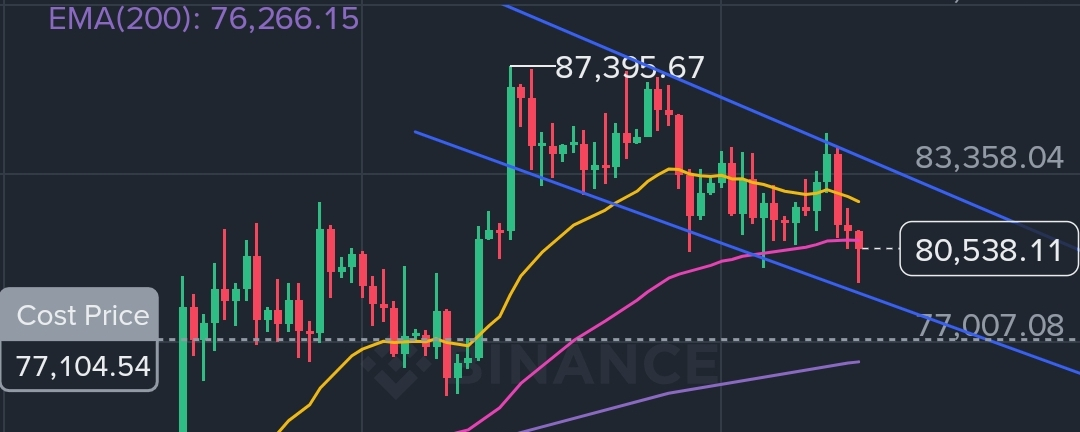

The crypto king Bitcoin ($BTC) is currently battling right at the $80,518 mark. Bears are trying hard to push it down while bulls are holding the line. Let’s dissect the structural reality using my 4-Indicator Strategy:
🔹 The Macro Channel (1D Frame): On the daily chart, Bitcoin is cleanly sliding inside a broad Descending Channel since its top at $87,395.67. The good news? We are currently sitting right on the channel's bottom support boundary. Furthermore, the daily EMA 200 ($76,266) remains undefeated, safeguarding the long-term bullish cycle.
🔹 The Short-Term Compression (1H Frame): On the intra-day frame, BTC managed a quick relief bounce from $79,220. However, it is facing heavy static resistance under the 1H EMA 20 ($80,645) and EMA 50 ($81,161). The short-term dynamic bias remains bearish as long as we are trading below the 1H EMA 200 ($81,977).
🔹 The StochRSI Divergence Setup: This is a classic setup to watch:
• 1D StochRSI: Sitting at 0.00 (Max Oversold Floor) — Sellers are mathematically hitting a wall on the macro frame.
• 1H StochRSI: Flying high at 93.30 (Max Overbought) — The local intra-day relief rally is heavily overextended and needs to breathe.
🎯 The Strategic Game Plan:
• 🛒 The Accumulation Zone: For mid-term spot buyers, loading up heavily around the $78,500 - $79,500 channel support zone offers an exceptional risk-to-reward ratio.
• 🚀 The Breakout Trigger: Scalp long positions will trigger aggressively once BTC breaks and closes a 1H candle above $81,200, targeting $82,700+.
• 🛑 The Risk Limit: A daily candle closing below $76,000 completely invalidates the current macro structure.
💬 Let’s see who is smart trading this zone:
📊 What is your target for Bitcoin by the end of this week?
1️⃣ Comment 'PUMP' if $80K holds and we run to $85K!
2️⃣ Comment 'DUMP' if we break below $78K next!
Drop your active trade entries or charts below! 👇
#BTC #bitcoin #CryptoAnalysis #TechnicalAnalysis #TradingSignals