📉 BNB/USDT Technical Analysis — Next 12 Hours
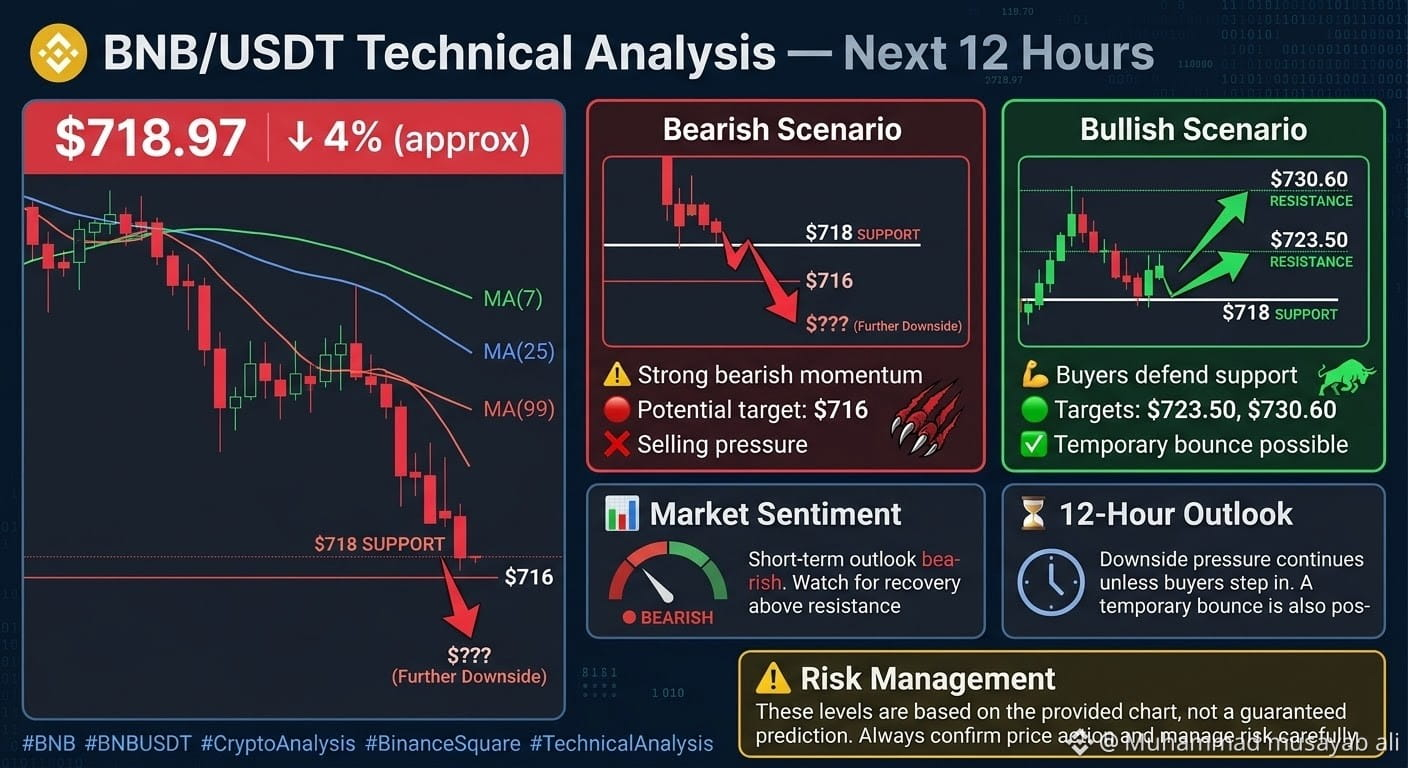
BNB is trading at $718.97, down approximately 4% on the chart. The price is showing strong bearish momentum and is trading below the MA(7), MA(25), and MA(99), indicating continued selling pressure.
🔴 Bearish Scenario: If BNB breaks below the $718 support level, further downside toward $716 and lower levels may be possible.
🟢 Bullish Scenario: If buyers defend support and the price recovers, $723.50 and $730.60 are potential resistance levels to watch.
📊 Market Sentiment: Bearish in the short term. A confirmed recovery above resistance would be needed to improve the outlook.
#BNB #BNBUSDT #CryptoAnalysis #BinanceSquare #TechnicalAnalysis
$BNB
BNB is trading at $718.97, down approximately 4% on the chart. The price is showing strong bearish momentum and is trading below the MA(7), MA(25), and MA(99), indicating continued selling pressure.
🔴 Bearish Scenario: If BNB breaks below the $718 support level, further downside toward $716 and lower levels may be possible.
🟢 Bullish Scenario: If buyers defend support and the price recovers, $723.50 and $730.60 are potential resistance levels to watch.
📊 Market Sentiment: Bearish in the short term. A confirmed recovery above resistance would be needed to improve the outlook.
#BNB #BNBUSDT #CryptoAnalysis #BinanceSquare #TechnicalAnalysis
$BNB