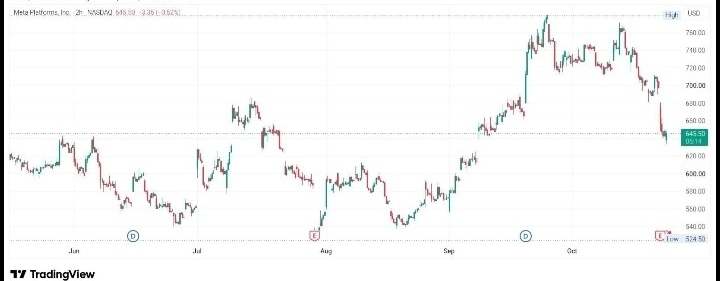

Meta Platforms has come under significant selling pressure after retreating from its recent highs near $780. The stock is trading around $645.50 on the 2-hour chart, according to the TradingView screenshot captured on October 23, 2026. The recent decline has changed the short-term market structure, leaving investors watching closely for signs of stabilization or further downside.
The chart shows that META experienced a strong recovery from its August lows before rallying sharply through September. However, the momentum that supported the rally has weakened, and sellers have driven the price back toward the $640–$650 area. The latest candles show a sharp downward move, suggesting that selling pressure has increased.
The first level I would watch is the $640 zone. If buyers defend this region and push the price higher, META could attempt a recovery toward $660. A sustained move above that level could open the door for a further test of $680, where the stock previously traded before the latest decline accelerated.
However, a rebound should not automatically be interpreted as a complete trend reversal. Buyers would need to demonstrate consistent demand and reclaim nearby resistance levels. Without that confirmation, any recovery could remain vulnerable to renewed selling pressure.
On the bearish side, a decisive break below $640 would be an important development to monitor. If selling continues, the next visible areas of interest on the chart are around $620 and $600. These are potential reference zones rather than guaranteed destinations, and price action would need to confirm whether sellers retain control.
The broader structure also deserves attention. META's rally toward $780 showed strong upward momentum, but the subsequent decline has weakened that bullish picture in the short term. The stock is now trading considerably below its recent peak, and the immediate question is whether this represents a temporary correction or the beginning of a more extended downward move.
Individual technology stocks can react sharply to earnings expectations, company announcements, changes in investor sentiment and broader movements across the technology sector. Technical levels provide a framework for interpreting price action, but they cannot explain every move or predict the market with certainty.
My overall view is that META is at an important short-term decision point. Buyers have an opportunity to establish support near the current price, but they need to demonstrate stronger momentum before a recovery can be considered convincing. Until then, volatility and additional downside remain possible.
The next move around $640 could provide a clearer indication of whether the stock is ready to stabilize or whether sellers intend to extend the decline. I would watch how the price behaves around support and resistance and wait for confirmation before drawing a stronger conclusion.
What do you think? Can META defend the $640 zone and recover toward $680, or will sellers push the stock down to $620 next? 📊
This analysis is for educational purposes only and should not be considered financial advice. Always DYOR before making investment decisions.$META $rMETA