🚨 BMT Surges 55%! Is BubbleMaps Token Preparing for a Rebound?
🔥 BMT is attracting traders' attention after a strong price jump!
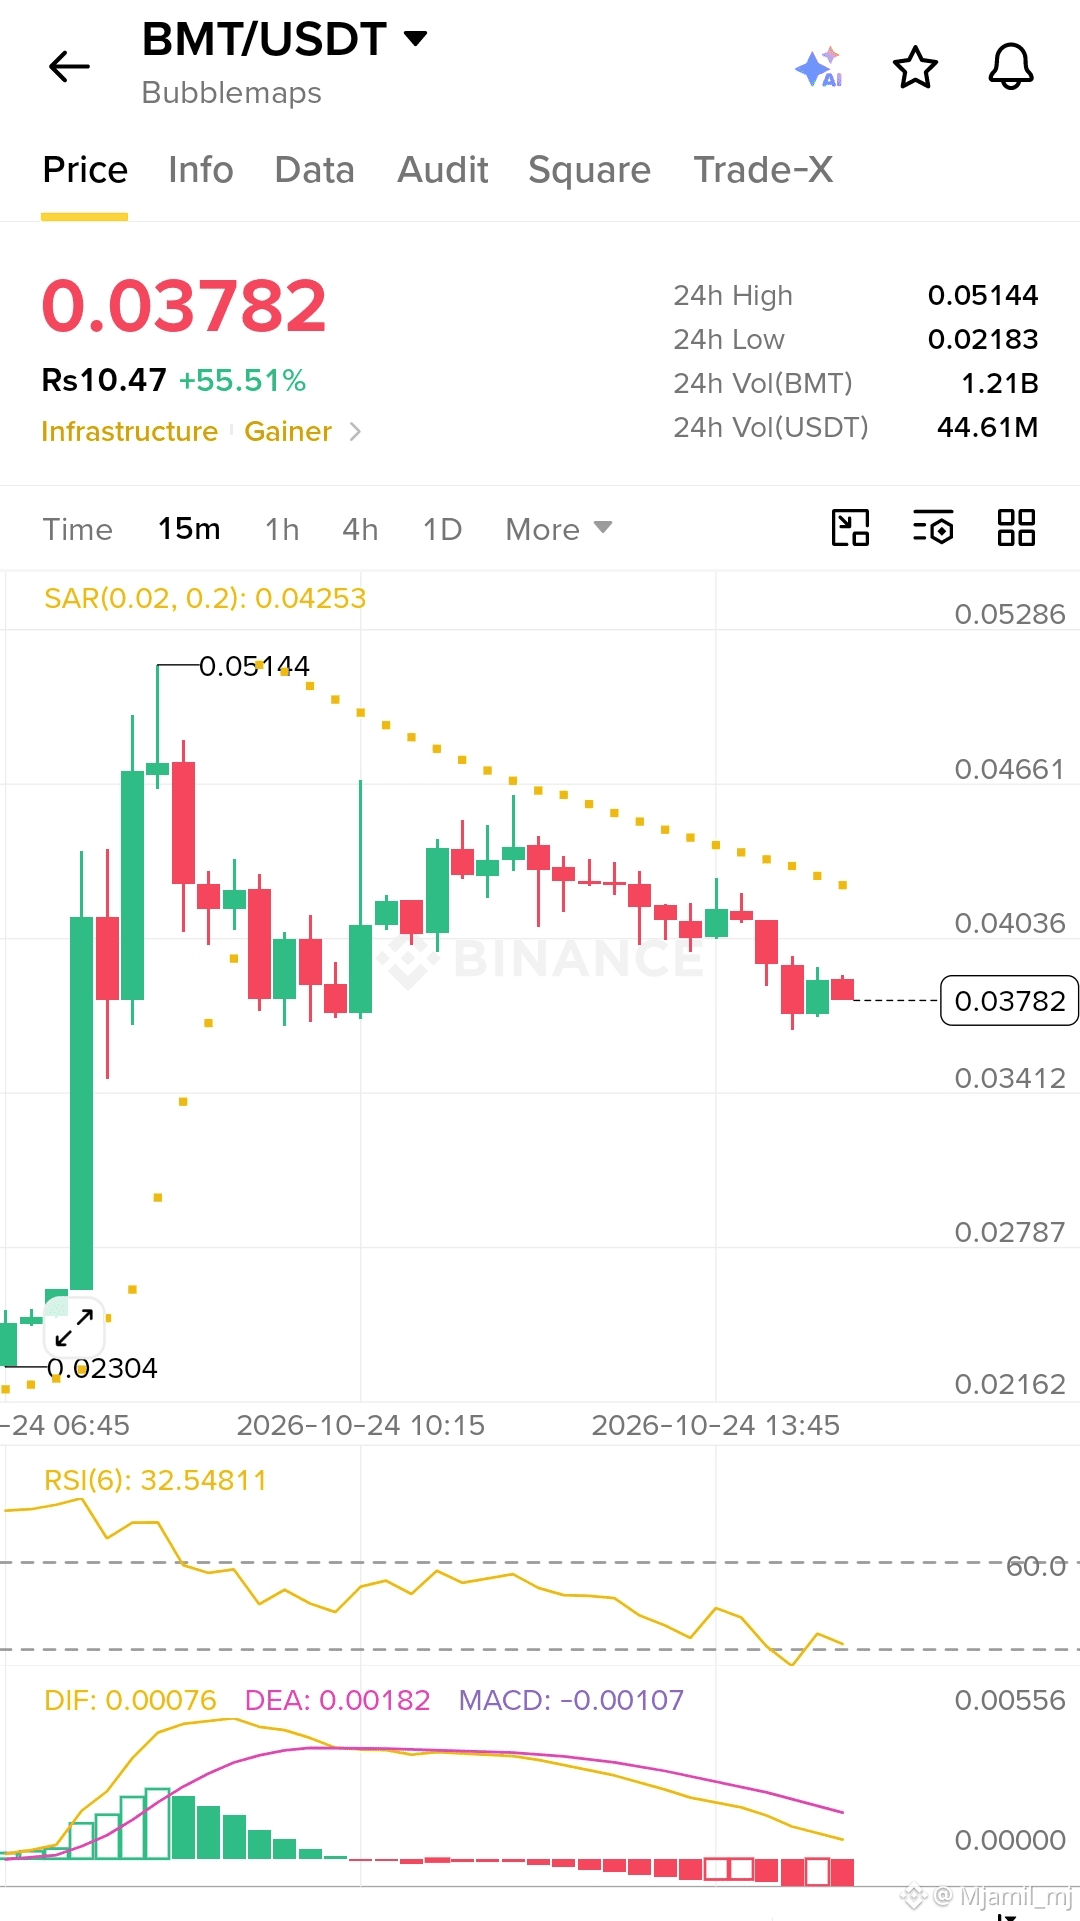
According to the chart captured on October 24, 2026, BubbleMaps (BMT) was trading around $0.03782, up approximately 55.51%. The token reached a 24-hour high of $0.05144, followed by a pullback as selling pressure increased.
📊 What Is the Chart Telling Us?
🔴 Short-Term Trend: The 15-minute chart shows lower highs and downward price movement after the initial rally, suggesting that sellers currently have the advantage.
⚠️ RSI(6) at 32.55: Momentum is weak and approaching oversold territory. A bounce is possible, but the RSI alone does not confirm a reversal.
📉 MACD Bearish: DIF is below DEA, and the histogram is negative. This indicates bearish momentum on the displayed timeframe.
🟡 Parabolic SAR: The SAR dots are above the latest candles, adding another sign of short-term downward pressure.
🎯 Important Price Levels to Watch
- Resistance 1: $0.0404–$0.0425
- Resistance 2: $0.0466
- Major resistance: $0.05144
- Support 1: $0.0341
- Lower support: $0.0279
🐂 Can BMT Recover?
If buyers defend the $0.0341 area and price moves back above $0.0404–$0.0425, a recovery attempt could develop.
However, a breakdown below support could lead to further downside. Traders should watch trading volume and wait for confirmation before assuming the rally will resume.
💡 Final Thoughts
BMT has posted a significant gain over the past 24 hours, but its 15-minute chart currently shows weakening momentum after the spike. The next move depends on whether buyers can establish support or sellers continue taking profits.
What is your prediction? 🚀 Will BMT recover toward $0.045, or 📉 will it test lower support first?
Share your thoughts below! 👇
This analysis is based on the supplied screenshot, not live market data. Cryptocurrency trading carries significant risk and this is not financial
#BMT #BubbleMaps #CryptoNews #Altcoins #CryptoTrading #TechnicalAnalysis #MACD #RSI #BinanceSquare $BMT $BTC $USDT