

Description:
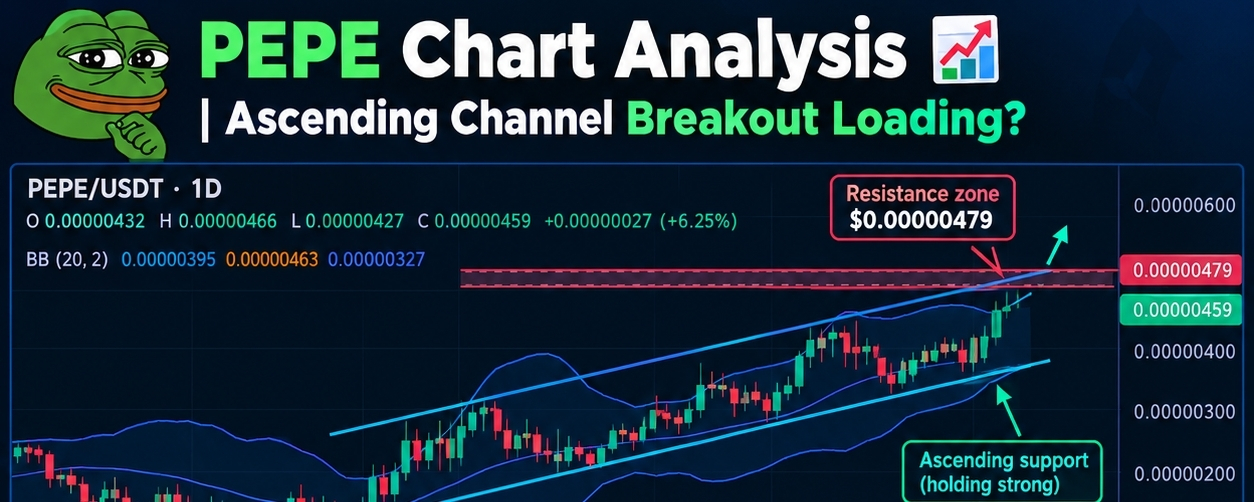
Let's look at the PEPE/USDT 1D chart. 👀
Here is what I'm seeing:
🔹 Price is respecting the ascending support line.
🔹 Bollinger Bands are widening, showing increased volatility.
🔹 RSI is sitting at 63.39 (bullish but not overbought yet).
🔹 Volume is starting to pick up.
Watch the resistance zone at $0.00000479. A daily close above that could send us testing the recent highs.
Disclaimer: Not financial advice, always do your own research! 📚🧠 #EarningsSeason #Binance #PEPE #analysis #Ethereum