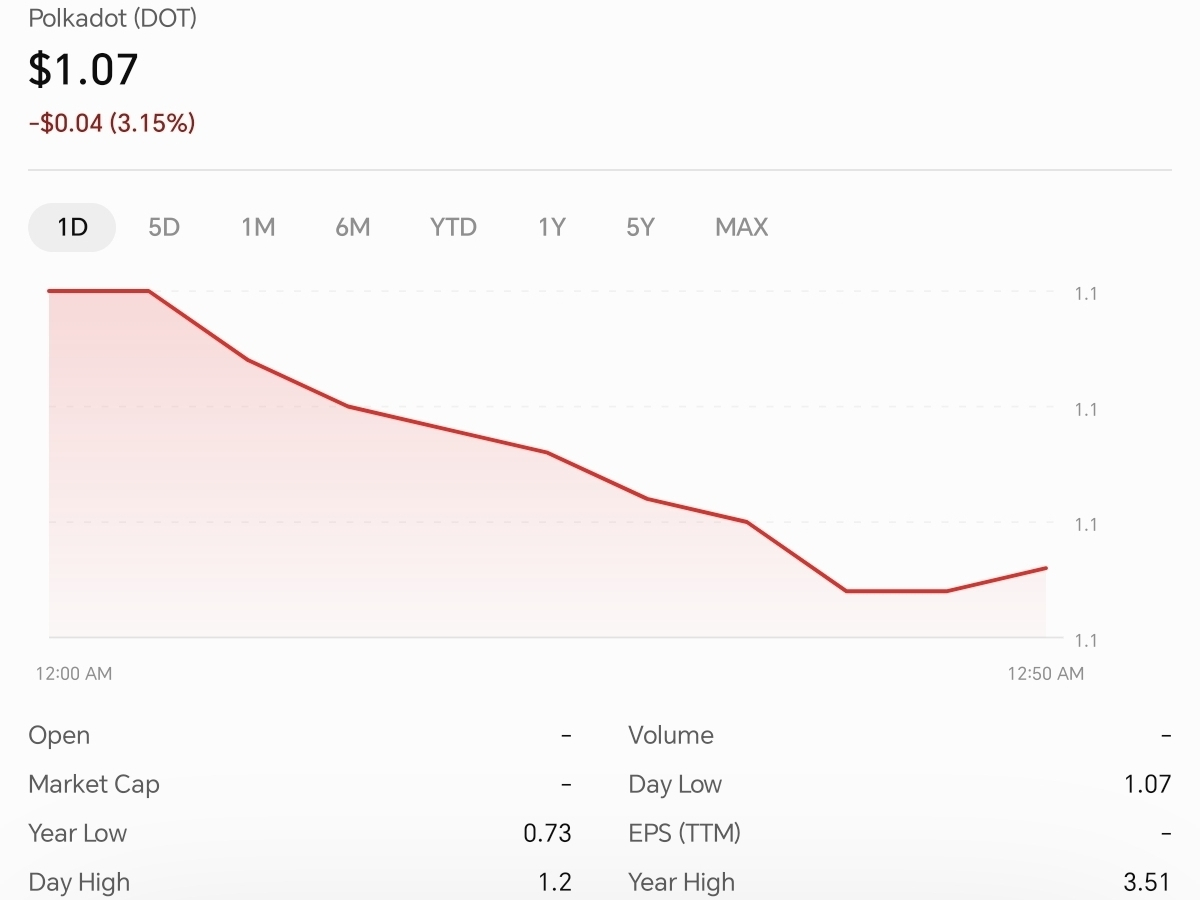

Based on the latest market analysis available, technical indicators, macroeconomic risks, and geopolitical factors.
My current outlook for Polkadot (DOT) is cautiously bullish in the short term, but bearish risk remains on the bigger trend. The key is whether DOT can hold its support and break above resistance with strong volume.
The latest market report I found, dated October 23, puts DOT around $1.12–$1.13, with a sharp increase in trading volume. The immediate resistance is around $1.14, while important support sits near $1.09.
1_My DOT price targets
Reference price: approximately $1.12–$1.13. These are scenario estimates, not guaranteed outcomes.
Bullish scenario
$1.18–$1.30
If DOT breaks resistance with strong volume and BTC stabilizes.
Base scenario
$1.08–$1.18
Choppy consolidation while buyers and sellers compete.
Bearish scenario
$1.02–$0.93
If $1.08 support fails and broader crypto selling accelerates.
Estimated short-term horizon: the next 1–4 weeks. Based on technical levels reported October 23.
2_International markets, war and financial activity
Here is how the major external factors could affect DOT.
Bitcoin and crypto liquidity
Bitcoin ETF outflows of approximately $635 million on October 22 created a risk for the wider crypto market. DOT could struggle if BTC loses important support near $80,000; sustained BTC stability would improve the outlook.
War and geopolitical tension
On October 23, Brent crude settled at $116.72 amid concerns about Middle East supply disruptions. Higher oil prices can increase inflation fears and pressure risk-sensitive assets such as altcoins.
Federal Reserve and interest rates
S&P Global's October outlook points to persistent inflation, higher yields and possible further rate increases. Tighter financial conditions would generally be a headwind for speculative crypto investments.
3. The DOT trading setup I would watch
DOT/USDT
Entry trigger
$1.14–$1.16
Breakout and retest
Targets
$1.18 / $1.23
Potential resistance zones
Invalidation
$1.08
A decisive breakdown weakens the setup
Lower support
$1.02
Next major area to monitor
This is a conditional setup, not a live order recommendation. Wait for a candle close above resistance and a successful retest; a stop should be set according to your risk tolerance and trade timeframe.
4. My strongest prediction
My preferred short-term scenario is a recovery toward $1.18, potentially extending to $1.23–$1.30 if buyers maintain momentum. However, the weekly technical picture remains weaker than the daily picture, so a rally is not yet proof of a long-term trend reversal.
I would not confidently predict $2 or $5 in the near term without stronger market-wide momentum and clear confirmation on the chart.
One important question: Are you looking for a DOT prediction for the next 24 hours, the next 7 days, or the next 3 months? That changes the targets and trading strategy considerably.