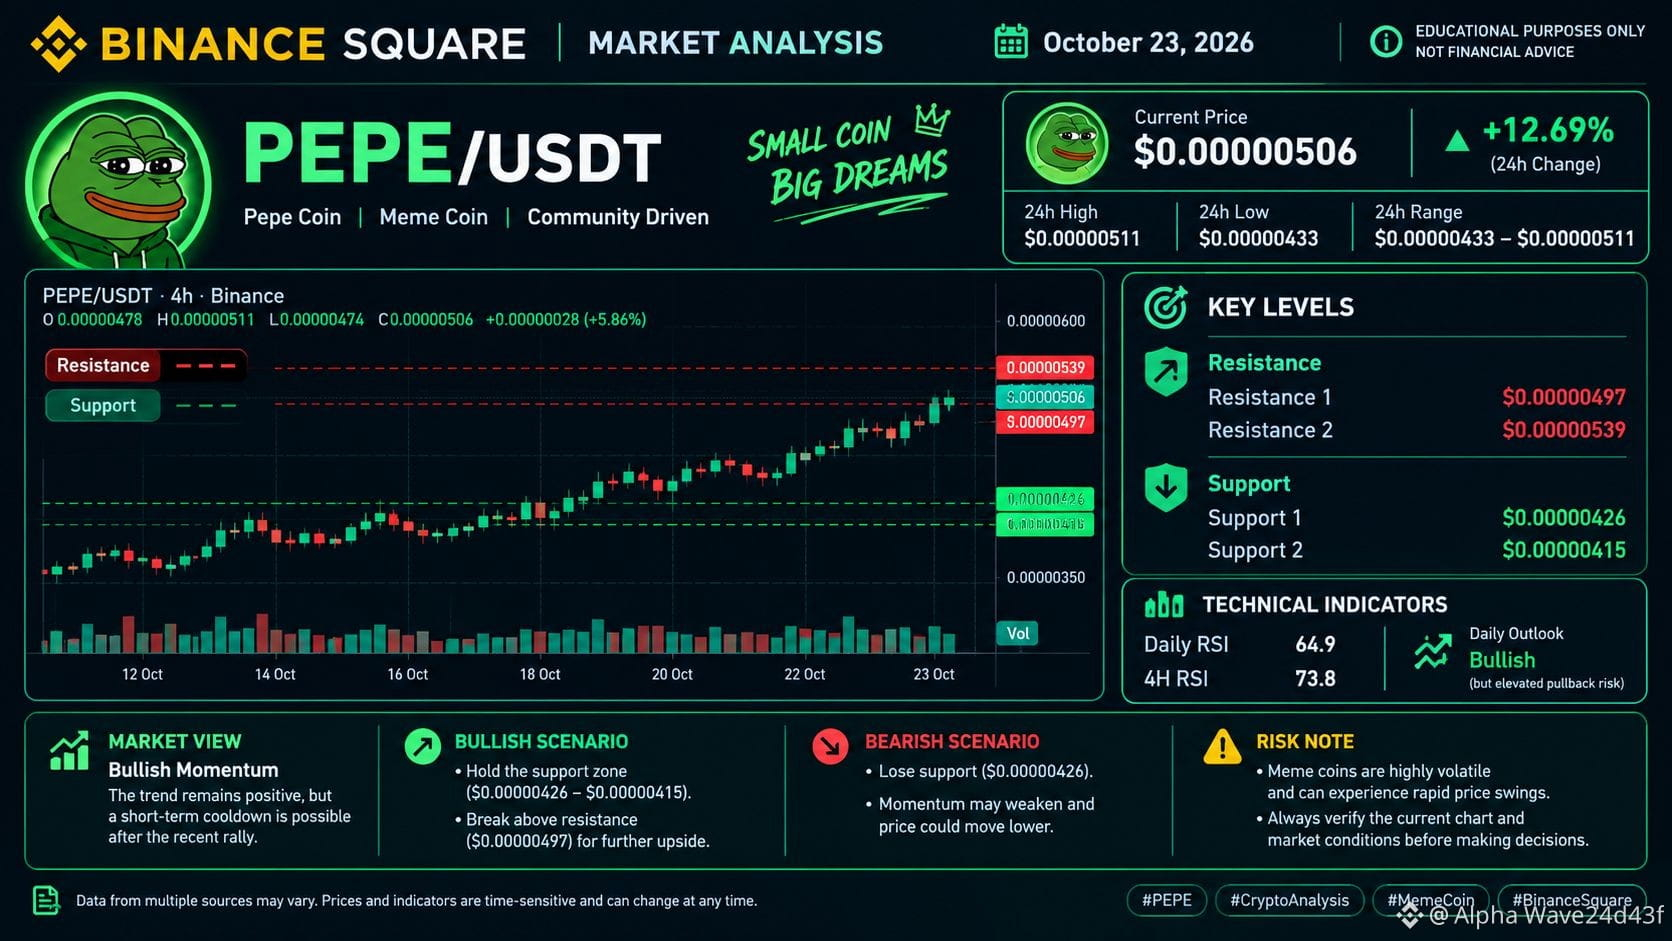
$PEPE 📊 PEPE/USDT — Detailed Market Analysis 📅 October 23, 2026
🟢 Market Bias: Bullish — Pullback Risk
PEPE is showing strong upward momentum, with the reported price near $0.00000506 and a 24-hour gain of approximately 12.69%. However, after a sharp rally, short-term volatility and a pullback remain possible.
📈 Key Price Levels
Resistance 1: $0.00000497
Resistance 2: $0.00000539
Support 1: $0.00000426
Support 2: $0.00000415
🔍 Technical Indicators
Daily RSI: 64.9
4H RSI: 73.8
Daily trend: Bullish
Momentum: Strong, with elevated short-term pullback risk
🟢 Bullish Scenario A sustained move above resistance may support further upside. Confirmation from candle closes and trading volume is important.
🔴 Bearish Scenario A break below the support zone could weaken the bullish structure and increase downside risk.
⚠️ Risk Management PEPE is highly volatile. These levels are reference points, not guaranteed entry, take-profit or stop-loss signals. Verify the live chart before drawing conclusions.
💬 Do you think PEPE can maintain its bullish momentum?
#PEPE #PEPEUSDT #CryptoAnalysis #TechnicalAnalysis #BinanceSquare