
📉 **KORUUSDT Market Analysis: Is a Reversal Coming, or Will the Downtrend Continue?**
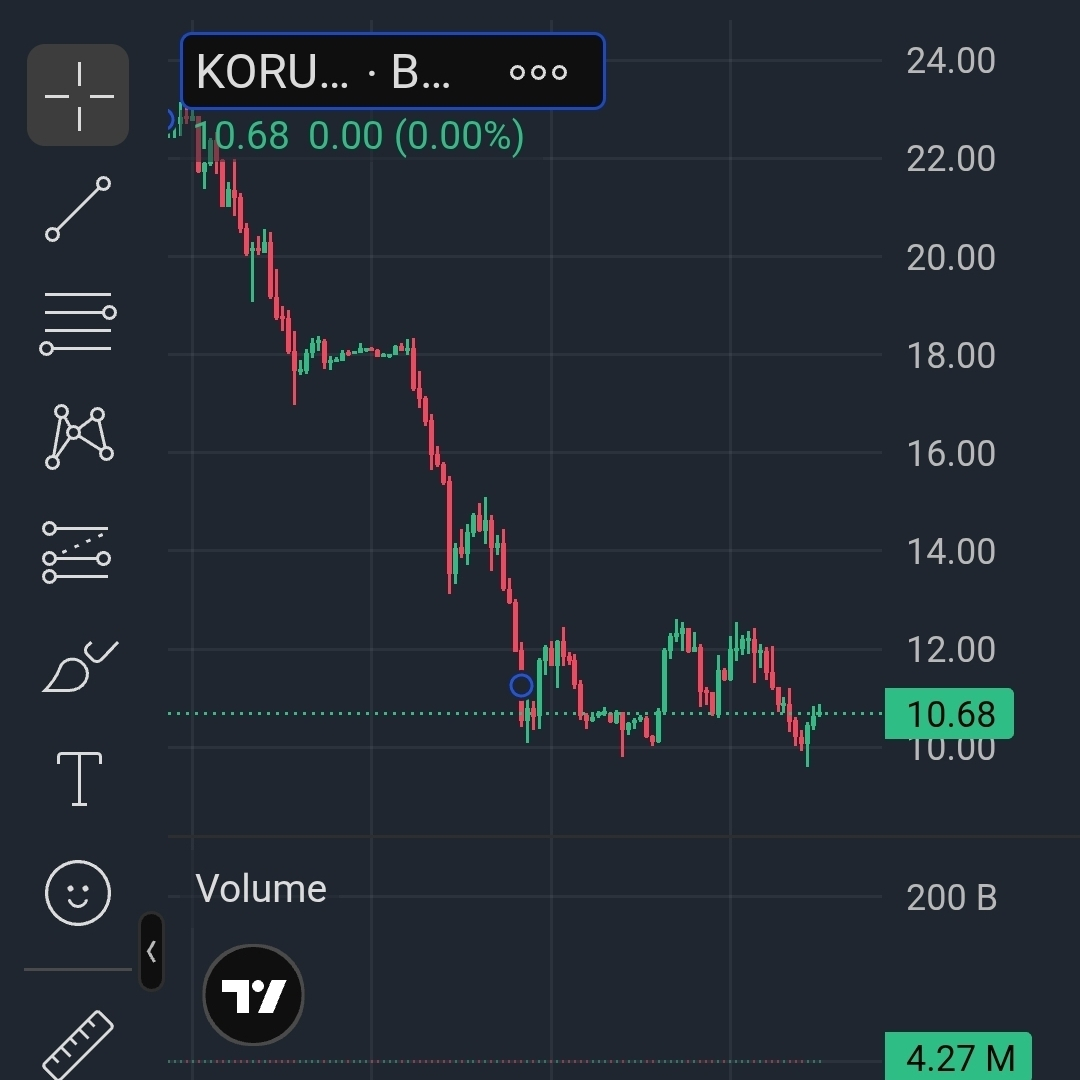
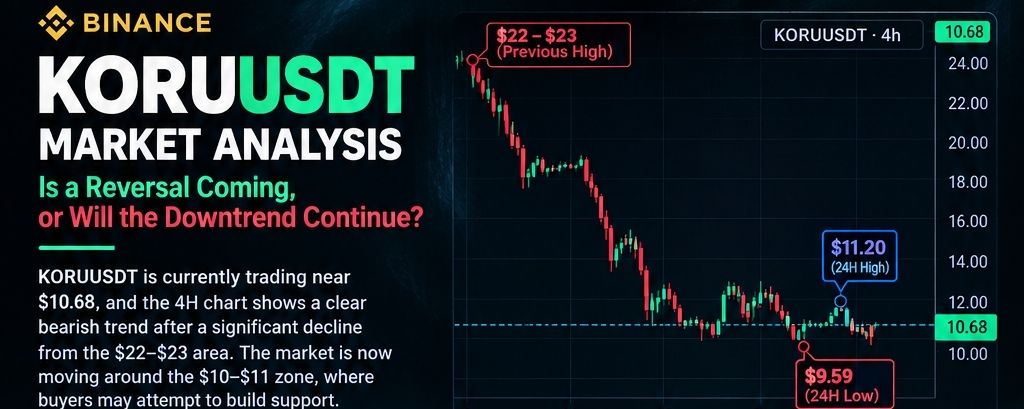
The cryptocurrency market is all about patience, discipline, and understanding price action. Looking at the 4-hour chart of KORUUSDT, one thing stands out clearly: the market has experienced significant selling pressure, falling from the $22–$23 region toward its current price around $10.68.
After such a substantial decline, traders naturally begin asking one important question: **Is KORUUSDT preparing for a recovery, or is the market still looking for lower prices?**
🔍 **Understanding the Current Market Structure**
The 4H chart continues to show a broader bearish structure. Price has formed a series of lower highs and lower lows, suggesting that sellers have maintained control over the overall trend. Although the market has experienced temporary rebounds, these upward moves have not yet established a convincing bullish reversal.
For buyers to regain confidence, KORUUSDT needs to demonstrate stronger buying pressure and begin breaking important resistance levels. Until that happens, any recovery should be viewed cautiously rather than automatically treated as a trend reversal.
📊 **Key Price Levels to Watch**
The $10.00 area is an important psychological zone to monitor. If buyers continue defending this region and price begins forming higher lows, a short-term recovery could develop.
On the upside, $11.20 represents the recent 24-hour high shown in the chart. A convincing breakout above this level, supported by increasing volume, could open the door to a test of the $12.00 region.
However, if price breaks below $10.00 with strong selling pressure, traders should watch for further downside movement. The recent 24-hour low near $9.59 is another level worth monitoring.
These are potential reaction zones, not guaranteed support or resistance levels. Market conditions can change quickly, particularly in volatile crypto assets.
⚡ **Volume and Confirmation Matter**
Price alone does not tell the complete story. Volume can help traders evaluate whether a breakout is attracting genuine participation or whether a move is losing momentum.
A breakout with stronger volume and sustained price acceptance above resistance may provide more convincing evidence of bullish strength. In contrast, a move above resistance that quickly fails could turn into a false breakout.
Likewise, a breakdown below support accompanied by strong selling volume may indicate that sellers remain in control.
🎯 **The Trading Mindset**
One of the biggest mistakes traders make is trying to predict the exact bottom of a falling market. A coin that has already dropped significantly can still decline further. At the same time, a bearish chart can eventually produce a sharp recovery.
Instead of reacting emotionally, focus on confirmation, market structure, volume, and risk management. Wait for the market to show its direction rather than entering a trade simply because the price looks cheap or because a rebound seems overdue.
🚀 **Final Thoughts**
KORUUSDT is approaching an important area where the next price movement could provide valuable clues about market sentiment.