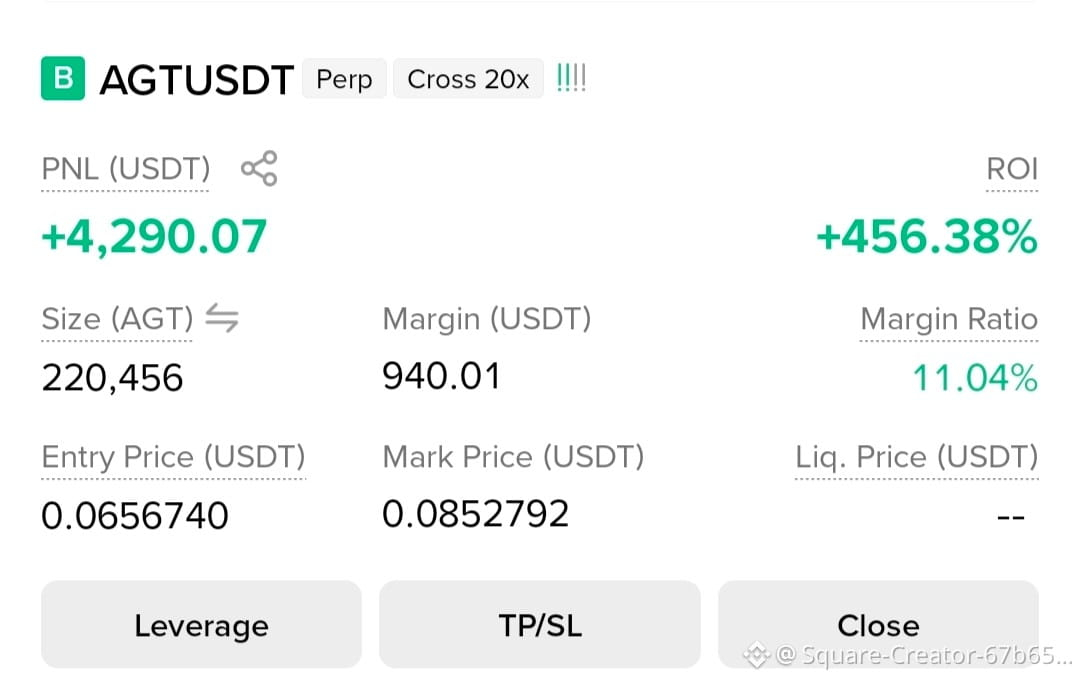
📊 AGT/USDT Futures Analysis
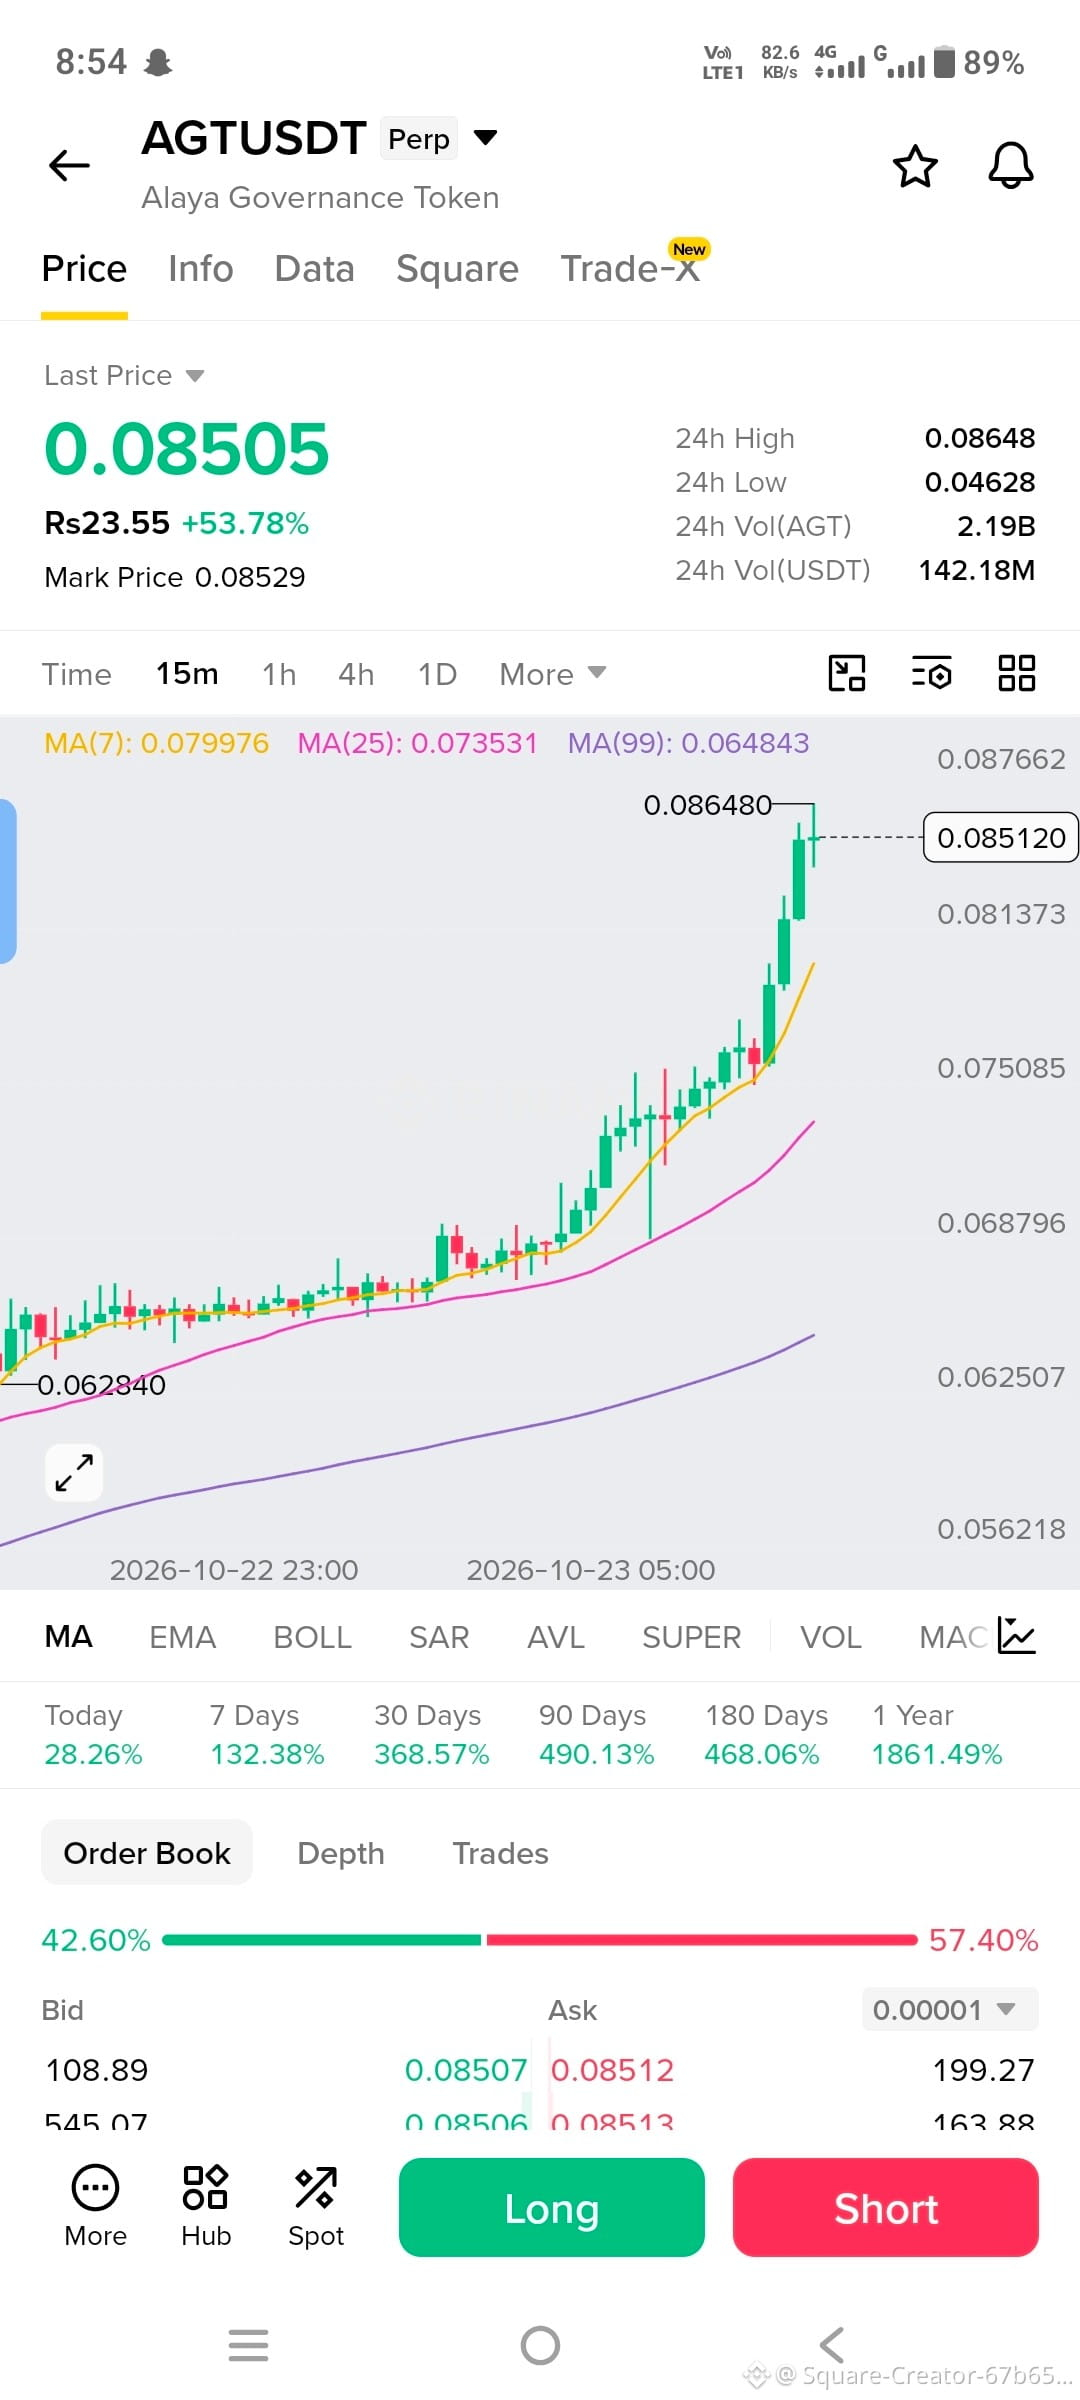
Timeframe: 15 Minutes
Current Price: $0.08505
24H Change: +53.78% 🚀
🟢 Resistance Levels
$0.08648 — Immediate resistance and recent high.
$0.08750 — Potential upside target after a breakout.
$0.08900–$0.09000 — Higher target if bullish momentum continues.
🔴 Support Levels
$0.08300 — First potential support zone.
$0.08000 — Important support.
$0.07998 — Near the 7-period moving average shown on your chart.
$0.07500 — Deeper support if a significant pullback occurs.
📈 Will AGT Go Higher or Lower?
🟢 Bullish Scenario: If AGT breaks above $0.08648 and holds, it could move toward $0.08750 and potentially $0.09000.
🔴 Bearish Scenario: If the price fails to break resistance, profit-taking could trigger a pullback toward $0.08300 or $0.08000.
🎯 My Trading View
Short-term trend: Bullish, but caution is necessary.
The price is trading above all three moving averages shown.
AGT has already gained over 53% in 24 hours.
After such a sharp rally, a correction or sideways consolidation is possible.
⚠️ Futures warning: Avoid chasing the price after a sharp pump. Wait for confirmation, use a stop-loss, and be careful with high leverage.
Key level to watch: $0.08648. A confirmed breakout could support further upside, while rejection may lead to a pullback.
This analysis is based on your screenshot, not live-market verification. The targets are estimates, not guaranteed prices.