Did everyone get the results they were looking for in BTC over the past two days?
Here’s my market breakdown:
1. Higher Timeframe: Overall Bearish
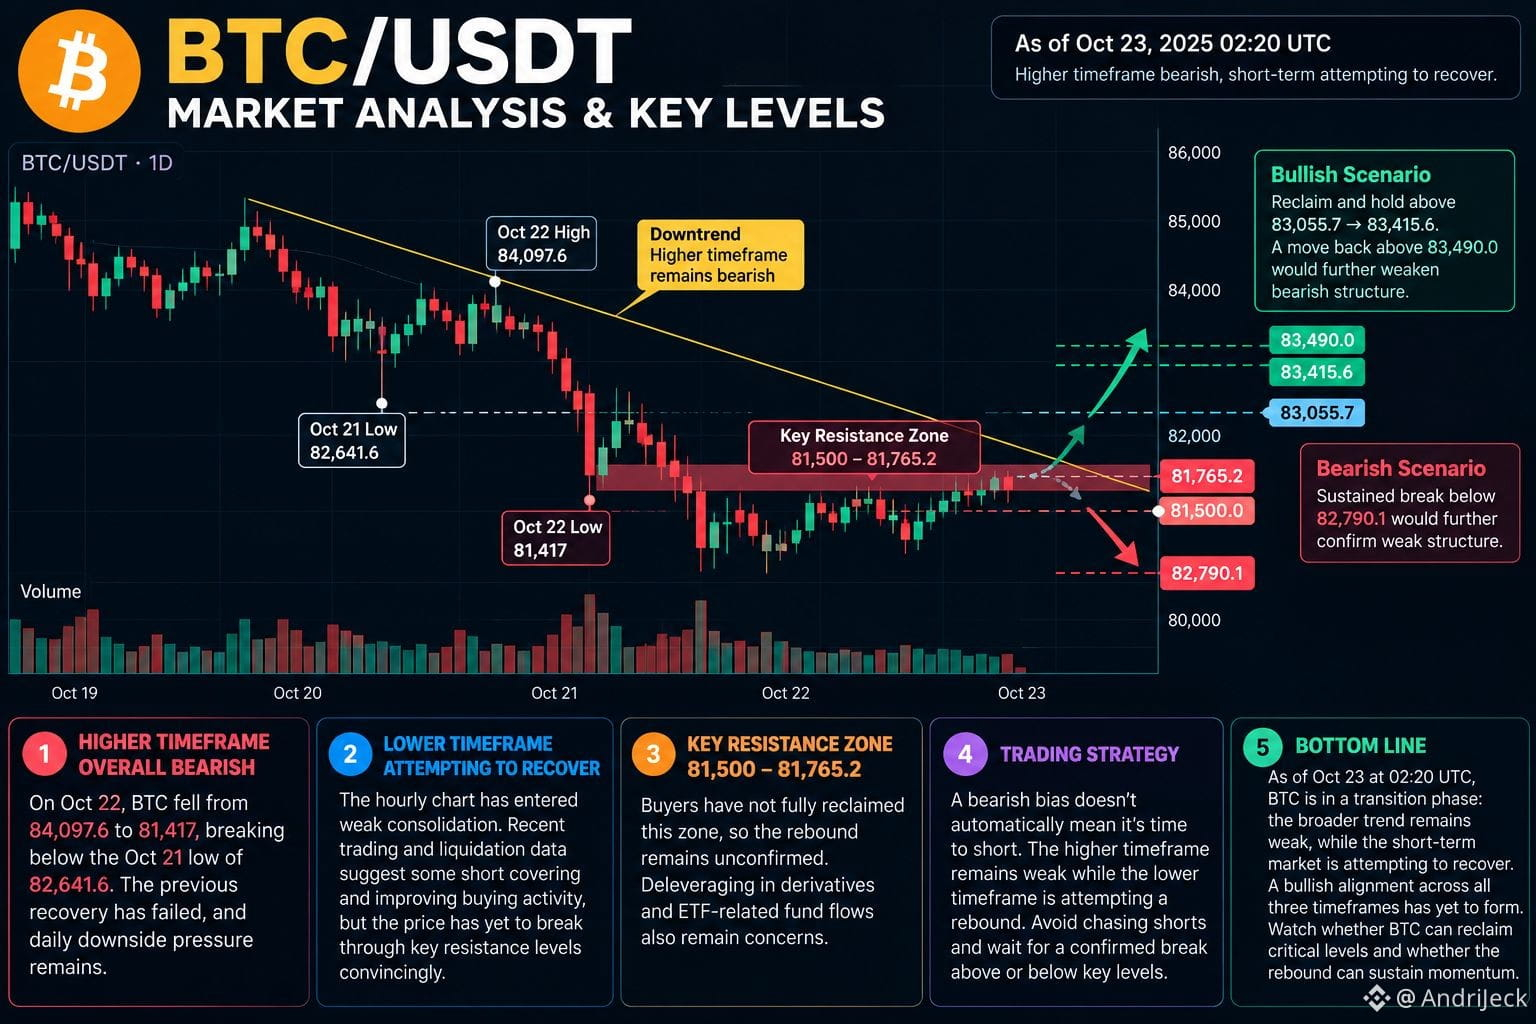
On October 22, BTC fell from $84,097.6 to $81,417, breaking below the October 21 low of $82,641.6. This signals that the previous recovery has failed, with daily downside pressure still in place.
2. Lower Timeframe: Attempting to Recover After a Sharp Drop
The hourly chart has entered weak consolidation. Recent trading and liquidation data suggest some short covering and improving buying activity, but the price has yet to break through key resistance levels convincingly.
3. Key Resistance Zone: $81,500–$81,765.2
Buyers have not fully reclaimed this zone, so the rebound remains unconfirmed. Deleveraging in derivatives and ETF-related fund flows also remain concerns.
4. Trading Strategy: Bearish Bias Doesn’t Automatically Mean It’s Time to Short
The higher timeframe remains weak while the lower timeframe is attempting a rebound. Chasing shorts too aggressively could expose traders to a potential bounce. It’s better to wait for a confirmed break above or below key levels before assessing the next directional move.
Bottom Line
As of October 23 at 02:20 UTC, BTC is in a transition phase: the broader trend remains weak, while the short-term market is attempting to recover. A bullish alignment across all three timeframes has yet to form. The key is to watch whether BTC can reclaim critical levels and whether the rebound can sustain its momentum.