


AltLayer (ALT) has faced intense selling pressure, with the price around $0.00830–$0.00834 in the chart snapshot and a reported 24-hour decline of approximately 39%.
But the key question is: Will buyers defend $0.00746, or could ALT face another leg down?
📉 1H Chart: Sellers Still Have the Advantage
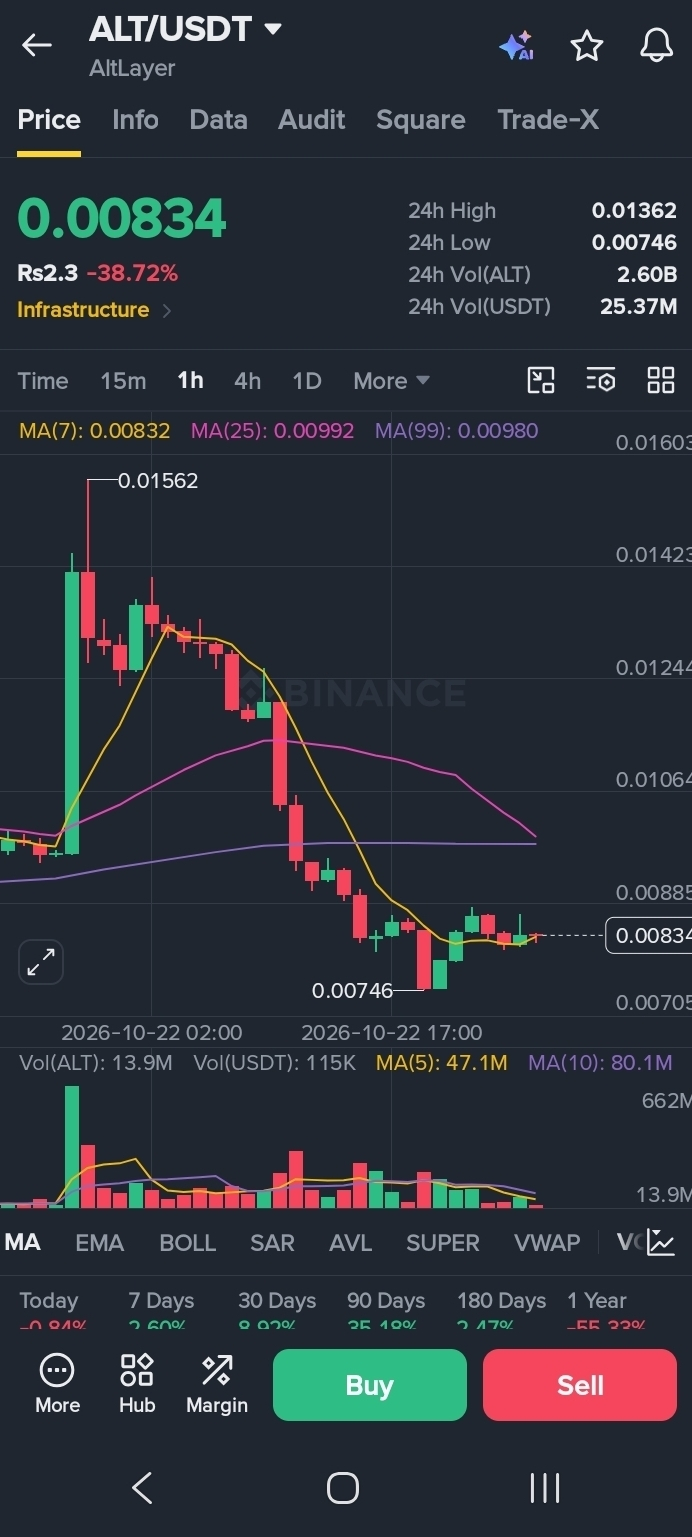
ALT is trading near its 1H MA(7) at $0.00832, while the MA(25) at $0.00992 is significantly above the current price. This suggests that short-term recovery still needs confirmation.
Key levels to watch:
Support: $0.00746
First recovery area: $0.00885
Resistance zone: $0.00980–$0.00992
📊 1D Chart: A Critical Test
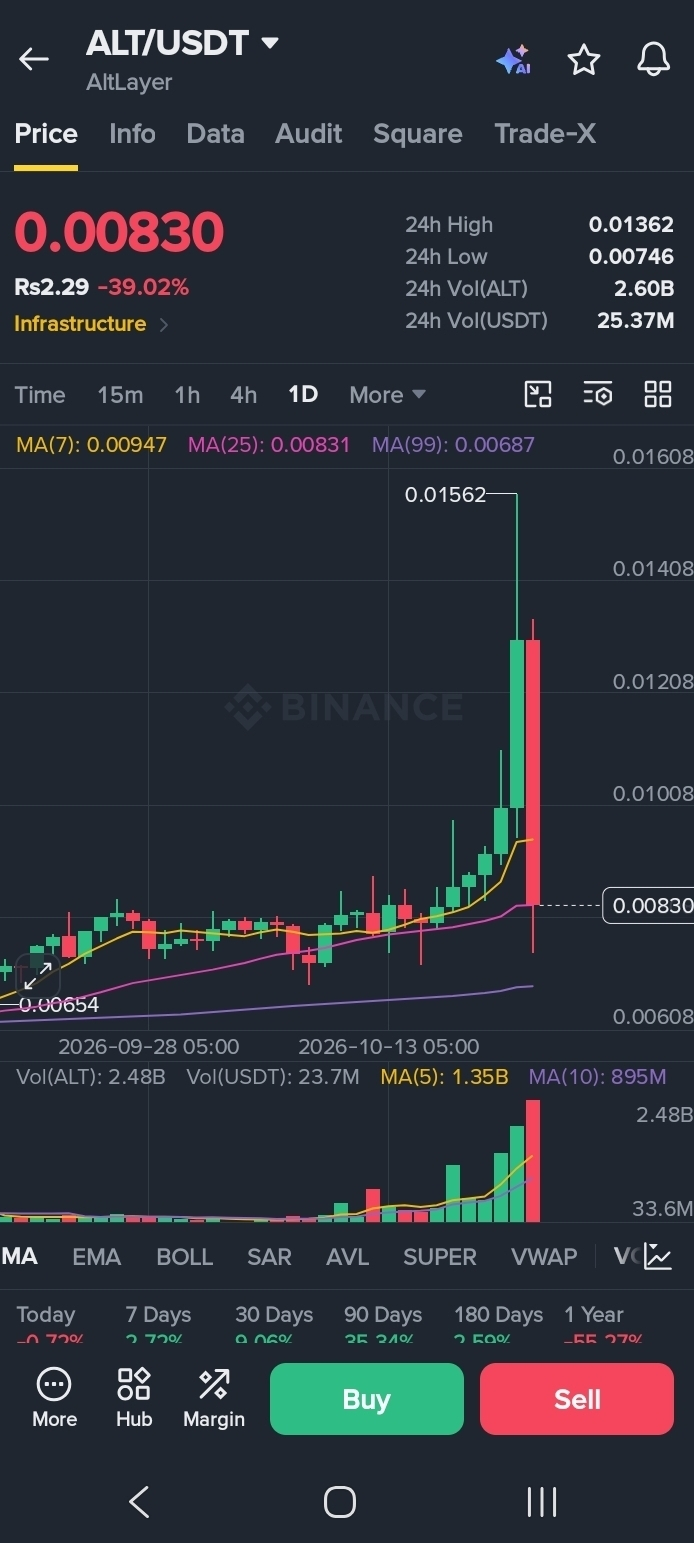
On the daily chart, ALT is near its MA(25) at $0.00831 but remains below the MA(7) at $0.00947. The MA(99), around $0.00687, is a lower reference level if selling pressure continues.
🚀 Bullish Scenario
If ALT holds $0.00746 and buyers push the price back above $0.00885, a recovery toward the $0.00980–$0.00992 resistance zone could become possible. Strong buying volume and sustained price action would help confirm this scenario.
⚠️ Bearish Scenario
A decisive break below $0.00746 could indicate further weakness. In that case, traders may watch the lower $0.00687 area as a reference—not as a guaranteed target.
💡 My Take
After such a sharp decline, chasing a quick rebound can be risky. I would watch how ALT behaves around support and wait for confirmation instead of assuming the bottom is already in.
What do you think? Will ALT recover from $0.00746, or could sellers push it lower?
Share your view in the comments.
Disclaimer: This article is for educational and informational purposes only, not financial advice. The analysis uses the chart figures provided in the screenshots and may not reflect the current live market. Cryptocurrency trading involves significant risk.