


🥇 Gold (XAU/USD) Day-Trading Analysis — 22 October 2026
📊 Market focus: Spot gold in US dollars • 15-minute candlesticks • Intraday trading plan • Outlook for Friday, 23 October 2026
Gold day trading requires three things: current market structure, confirmed price levels, and a disciplined plan for the next session. A 15-minute chart helps identify breakouts, pullbacks, liquidity sweeps, and potential entry points.
⚠️ I don't have a verified live price feed or today's complete 15-minute OHLC candle data in this conversation. I won't invent prices, support and resistance levels, or candlestick patterns and present them as real market data.
📌 Today's Gold Market Snapshot
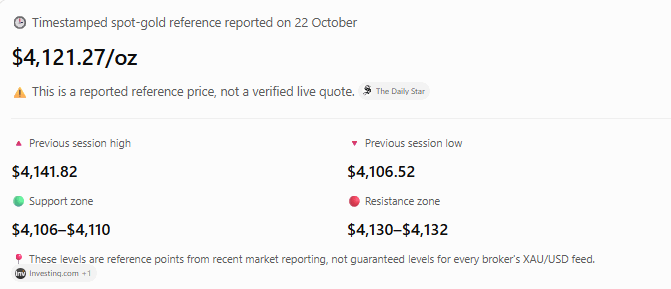
📉 Recent reporting points to continued downside pressure amid elevated oil prices, inflation concerns, and expectations surrounding US interest rates. Safe-haven demand could still trigger sharp recoveries.
🌍 Fundamental Analysis: What Is Driving Gold?
📈 US Treasury Yields and Interest Rates
🔹 Rising yields generally increase the opportunity cost of holding non-yielding gold.
🔹 Falling yields can support gold prices by making the metal relatively more attractive.
🔹 Traders are watching the Federal Reserve's 27–28 October meeting and the outlook for monetary policy.
🎯 Trading takeaway: Monitor US Treasury yields alongside XAU/USD. Rising yields may reinforce selling pressure, while declining yields could support a recovery.
💵 US Dollar Strength
🔹 A stronger dollar can weigh on gold by making it more expensive for international buyers.
🔹 A weaker dollar can support demand for dollar-denominated gold.
🎯 Trading takeaway: Check whether the dollar index confirms or contradicts the current gold trend. Do not use the dollar as a standalone trading signal.
🛢️ Crude Oil and Inflation
🔹 Higher oil prices can increase inflation concerns and reinforce expectations of restrictive monetary policy.
🔹 Geopolitical tensions can simultaneously increase safe-haven demand for gold.
🎯 Trading takeaway: Do not automatically treat higher oil prices as bearish for gold. Watch how yields, the dollar, and gold respond together.
🌐 Geopolitical Developments
🔹 Escalating geopolitical tensions can increase demand for safe-haven assets.
🔹 Unexpected headlines can cause sharp price movements, wider spreads, and sudden reversals.
🎯 Trading takeaway: Avoid entering immediately before major news if your stop-loss cannot accommodate sudden volatility.
📌 Fundamental conclusion: The recent backdrop is bearish-to-cautious for gold, but a sustained change in Treasury yields, dollar strength, or safe-haven demand could quickly alter the outlook.
📊 Technical Analysis: Important Price Levels
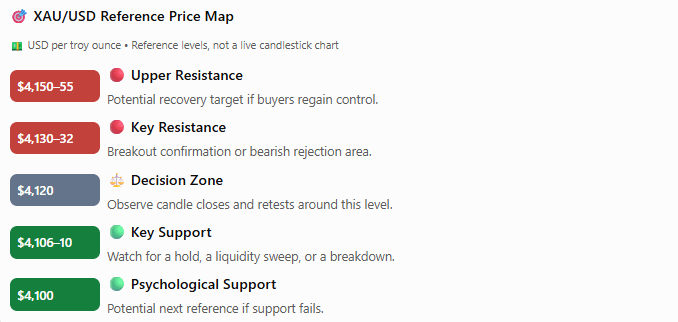
🕯️ 15-Minute Candlestick Chart
🔻 Bearish signal: Lower highs, bearish candle closes, and failed retests.
🟢 Bullish signal: Strong bullish candles, higher lows, and confirmed breakouts.
📊 Indicators: EMA 20, EMA 50, RSI (14), and volume.
🔗 Open Tradingview and select the 15-minute timeframe.
⚠️ Today's complete 15-minute candle data has not been verified here, so actual candle patterns cannot be confirmed.
🎯 Intraday Trading Setups
🔻 Sell scenario: A confirmed breakdown below $4,106 may expose $4,100. Look for a failed retest before considering entry.
🟢 Buy scenario: A sustained 15-minute close above $4,132 followed by a successful retest may open a move toward $4,140 and $4,150–$4,155.
⚖️ Range scenario: If price remains between support and resistance, trade only confirmed rejections and avoid entering in the middle.
🛑 Risk management: Set your stop-loss beyond the invalidation point and avoid chasing extended candles.
📅 Plan for Friday, 23 October
🌅 Asian session: Mark the overnight range and previous-day high and low.
🇬🇧 London session: Watch for liquidity sweeps, breakouts, and retests.
🇺🇸 New York session: Monitor US economic releases, the dollar, and Treasury yields.
📰 News calendar: Check tradingview economic calendar and set the timezone to Pakistan Standard Time (PKT).
📝 Trading journal: Record your entry, stop-loss, target, and risk before each trade.
🔍 Final Market Assessment
📉 Working bias: Bearish-to-neutral, with the possibility of a technical rebound.
Recent reporting points to pressure from oil-driven inflation concerns and expectations of restrictive US monetary policy. However, geopolitical developments and shifts in Treasury yields can quickly change the picture.
🔻 Below $4,106: Watch for confirmed continuation toward $4,100.
🟢 Above $4,132: Watch for a sustained recovery toward $4,140 and potentially $4,150–$4,155.
⚖️ Between the two boundaries: Remain selective and avoid forcing a trade.
🕒 For Friday: Update the outlook using the actual opening price, overnight range, completed 15-minute candles, and economic news.
⚠️ Chart limitation: I have not verified a complete set of today's 15-minute OHLC candles, so I cannot honestly provide an accurate candle-by-candle graph or claim that a particular pattern occurred. The live chart link above is the appropriate source for viewing actual candles.
📌 Disclaimer: This is educational market analysis, not personalized financial advice or a guaranteed trading signal. Gold trading can result in rapid and substantial losses.
#GoldMarketAnalysis #XAUUSDTradingStrategy #GoldDayTradingSetup #GoldTechnicalAnalysis