


$BTC Near $84K — Breakout or Another Bull Trap?
Bitcoin has surprised traders over the past five to six days with sharp moves in both directions, creating extremely difficult short-term trading conditions.
One of the key external drivers has been the sharp volatility in oil prices, as global markets continue reacting to geopolitical developments in the Middle East.
Now Bitcoin is approaching another major decision point:
Can BTC establish itself above $84,000, or is the latest recovery turning into another Bull Trap?
Macro Outlook
Oil has become an important driver of global Risk-On/Risk-Off sentiment, with sudden moves influencing U.S. equities, Bitcoin, and other major financial assets.
As geopolitical uncertainty remains elevated, sharp volatility in Bitcoin could continue.
On-Chain Outlook
Short-term Bitcoin whales transferred approximately 10,605 BTC to exchanges on October 20, around 2.8x their 30-day daily average.
At the same time, their unrealized profits have fallen by approximately 53% over the past month, from around $9.8B to $4.6B.
This increases the potential risk of additional selling pressure.
However, an important distinction remains:
Exchange inflows do not necessarily confirm that those BTC have actually been sold.
Technical Analysis
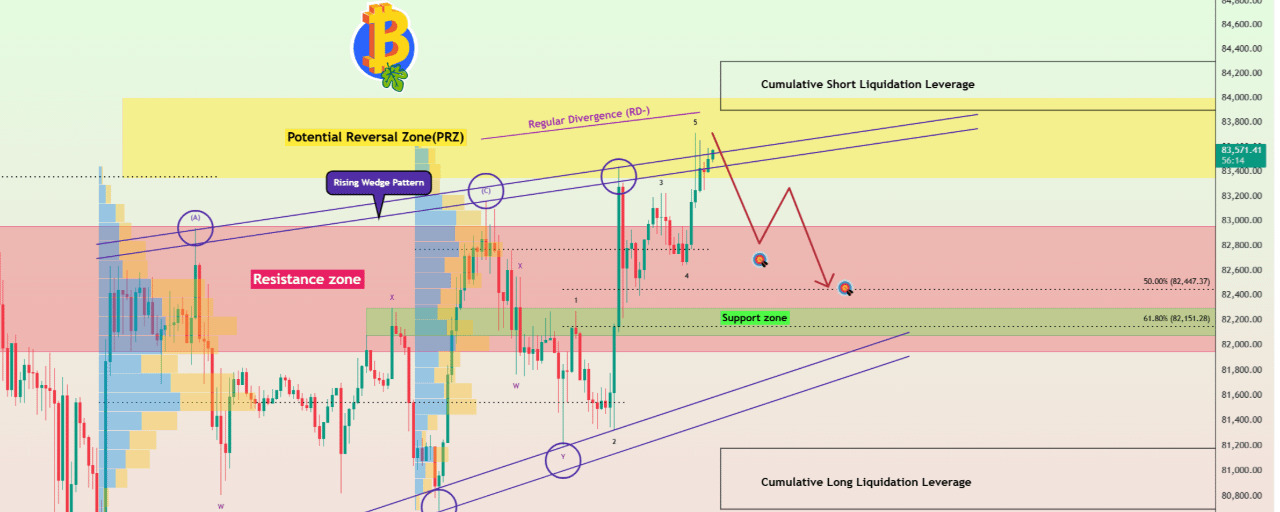
Bitcoin is currently trading above the Resistance Zone ($81,950-$82,960).
However, the latest bullish move has developed with relatively weak trading volume, making it difficult to consider the breakout fully confirmed.
BTC is also trading inside the major Potential Reversal Zone (PRZ) ($83,350-$84,000) and near the key $83,350 and $84,000 trading levels.
A confirmed breakout and stabilization above $84,000 could strengthen the bullish structure.
Otherwise, the latest recovery could develop into another Bull Trap.
From a classical technical perspective, the Rising Wedge Pattern also remains valid, keeping the risk of a bearish breakdown alive.
Elliott Wave Analysis
From an Elliott Wave perspective, Bitcoin appears to have completed a Five-Wave Impulsive Structure, suggesting that a corrective move could develop over the coming hours.
A Negative Regular Divergence (RD-) is also visible on the Monthly RSI between Consecutive Peaks, providing another warning that broader bullish momentum may be weakening.
Bearish Scenario
I expect Bitcoin to potentially decline toward the key $82,760 trading level over the coming hours.
The correction could then extend toward nearby Fibonacci Levels, with $82,500 becoming particularly important.
If BTC reaches this area with strong bearish momentum, further downside could develop.
However, if selling pressure weakens around $82,500, another short-term bullish recovery would not be surprising.
Trade Setup
First TP: $82,830
Second TP: $82,500
Stop Loss: $84,230
Key Levels: $81,550 | $82,760 | $83,350 | $84,000
Short Liquidation: ($83,900-$84,300)
Long Liquidation: ($80,700-$81,180)
Any major escalation or de-escalation in the Middle East could quickly change this setup. Under the current market conditions, risk management is more important than ever.
Can Bitcoin break and stabilize above $84,000?
🟢 Yes — Breakout confirmed
🔴 No — Bull Trap