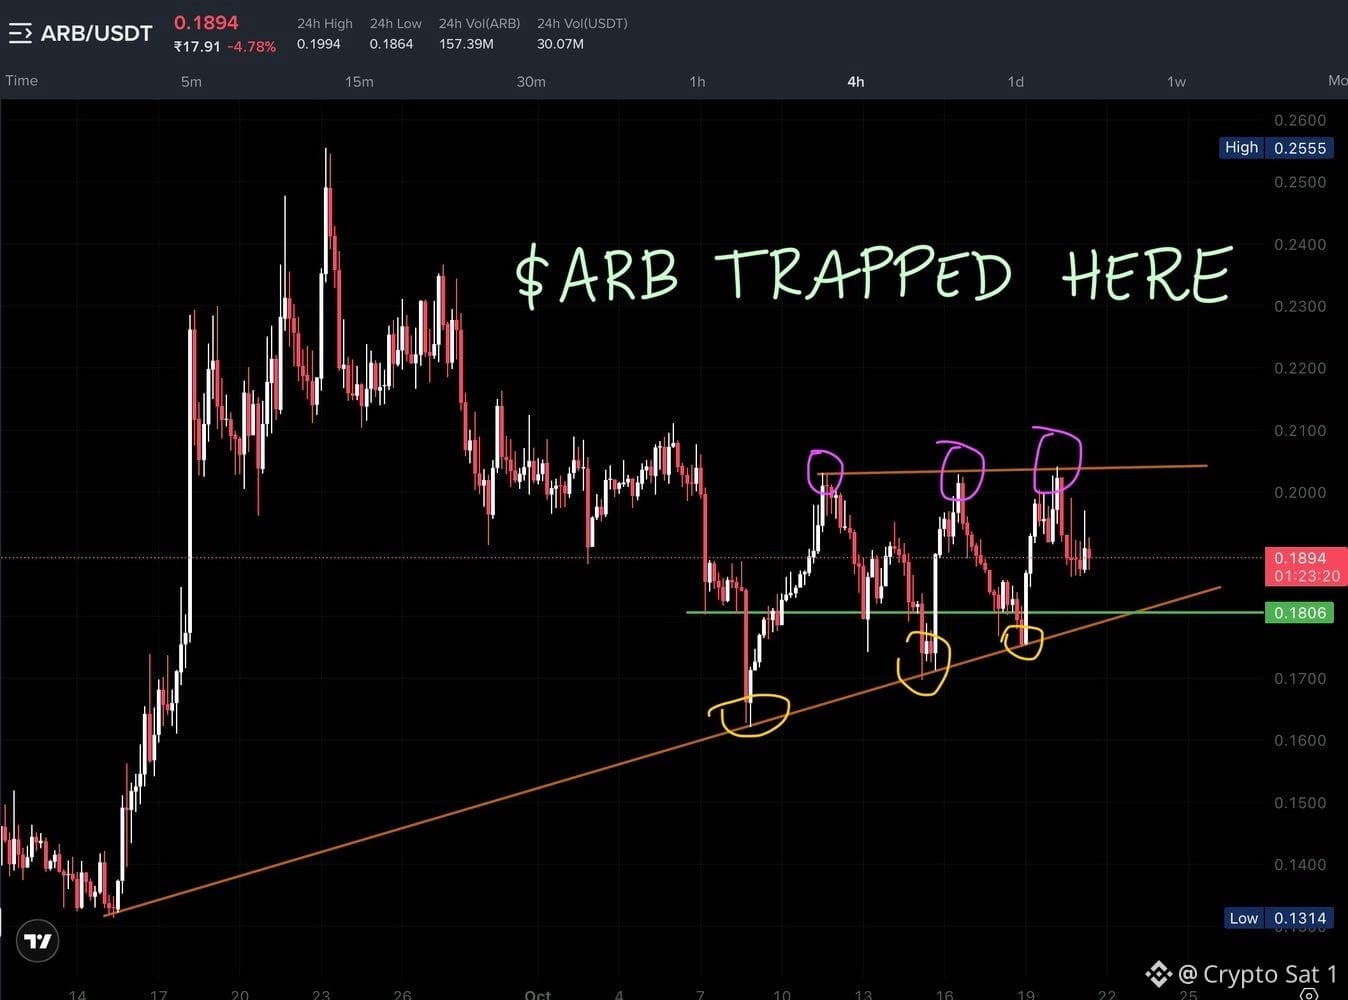
$ARB TRAPPED IN A SYMMETRICAL TRIANGLE — BIG MOVE LOADING?
Guys,price has been consolidating inside a triangle pattern, with lower highs and higher lows forming on the 4H chart. Buyers are defending the rising trendline, while sellers keep rejecting price around 0.20–0.202.
Currently trading near 0.1894, price is stuck between these key levels:
Resistance: 0.20–0.202
Support: 0.18, with stronger trendline support around 0.17
The next move depends on which side breaks first.
If ARB breaks above the upper trendline and sustains above 0.202, this could be the breakout we’re waiting for. The first major target is the previous high at 0.255, and if momentum kicks in, an extension toward 0.30–0.40 could come into play. The current downtrend may turn out to be consolidation before the next bigger leg up.
But don’t ignore the downside, guys.
If ARB loses 0.17, the bullish structure weakens and selling pressure could increase. The next support is around 0.16, but if that level also breaks, then 0.14–0.13 comes into sight.
My key levels:
Break 0.202 → 0.22, 0.23, 0.255
Hold 0.18–0.17 → consolidation structure remains alive
Lose 0.17 → 0.16, 0.14, 0.13
I’m watching the triangle breakout closely. No need to chase the price inside the pattern — let ARB show its direction first. 🔥