


Open any trading platform and the first thing you see is a chart full of red and green bars. Those are candlesticks, and they pack a surprising amount of information into a tiny shape. Once you can read them, price action stops looking like random noise.
Here’s what you need to know to get started.
Anatomy of a Candle
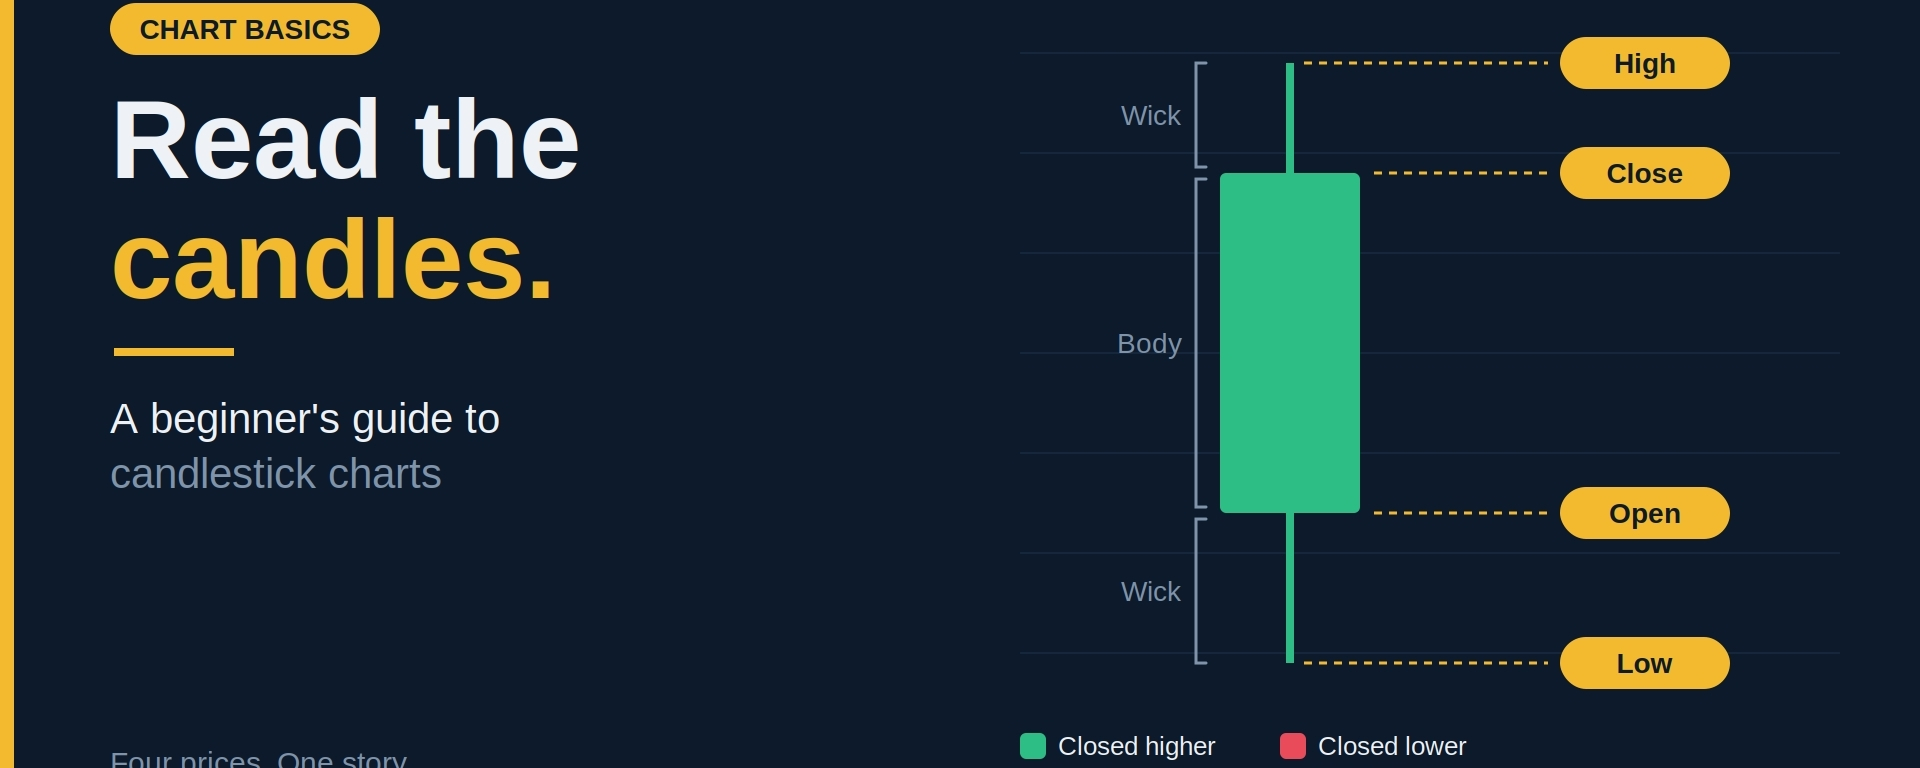
Every candle tells the story of one time period, such as one minute, one hour or one day. It has four data points:
Open: the price at the start of the period
Close: the price at the end of the period
High: the highest price reached
Low: the lowest price reached
The thick part is the body, which spans from open to close. The thin lines above and below are the wicks (or shadows), which show the high and low.
Green vs. Red
Most platforms use these defaults, though you can change the colors:
Green (bullish): the price closed higher than it opened
Red (bearish): the price closed lower than it opened
A long body means strong movement in one direction. A short body means the market was indecisive, or that buyers and sellers were roughly balanced.
What Wicks Tell You
Wicks show where price was rejected.
A long upper wick means buyers pushed the price up, but sellers pushed it back down before the close. It can signal selling pressure at that level.
A long lower wick means sellers pushed the price down, but buyers stepped in and drove it back up. It can signal buying interest at that level.
Wicks matter most when they appear near important support or resistance zones.
A Few Common Candle Patterns
Patterns are clues, not guarantees. Use them as context, not as a standalone trading signal.
Doji: open and close are almost the same, leaving a tiny body. It shows indecision, and can precede a pause or a turn.
Hammer: a small body at the top with a long lower wick. After a decline, it suggests buyers defended a low.
Shooting star: a small body at the bottom with a long upper wick. After a rise, it suggests sellers rejected higher prices.
Engulfing candle: a candle whose body completely covers the previous candle’s body. A bullish engulfing after a drop, or a bearish engulfing after a rise, can hint at a shift in momentum.
Timeframes Matter
The same chart looks very different on different timeframes. A 5-minute candle is mostly noise, while a daily or weekly candle carries more weight.
A good habit is to check the higher timeframe first to understand the bigger trend, then zoom in to plan your entry.
Don’t Read Candles in Isolation
A single candle rarely means much on its own. Strengthen your read by checking:
Location: is it at a key support or resistance level?
Trend: is it with or against the larger direction?
Volume: does trading activity confirm the move?
Confirmation: did the next candle follow through?
A hammer in the middle of nowhere is just a candle. A hammer at strong support with rising volume is worth paying attention to.
Common Beginner Mistakes
Treating every pattern as a guaranteed signal
Trading off tiny timeframes with no bigger picture
Ignoring risk management because a candle “looks bullish”
Trying to memorize dozens of patterns instead of mastering a few
The Bottom Line
Candlesticks are a language. You don’t need to know every word to start reading it, just the basics: open, close, high, low, body and wick. Combine that with trend, levels and sound risk management, and you’ll have a much clearer view of what the market is doing.
Practice by scrolling through old charts and asking what the candles were telling you at each point. It’s free, and it builds the skill fast.
Which candle pattern do you watch most? Tell me in the comments. 👇
Disclaimer: This article is for educational purposes only and is not financial advice. Crypto assets are highly volatile and you can lose your capital. Always do your own research and only invest what you can afford to lose.
#Crypto #CandlestickCharts #TechnicalAnalysis #TradingBasics #BinanceSquare