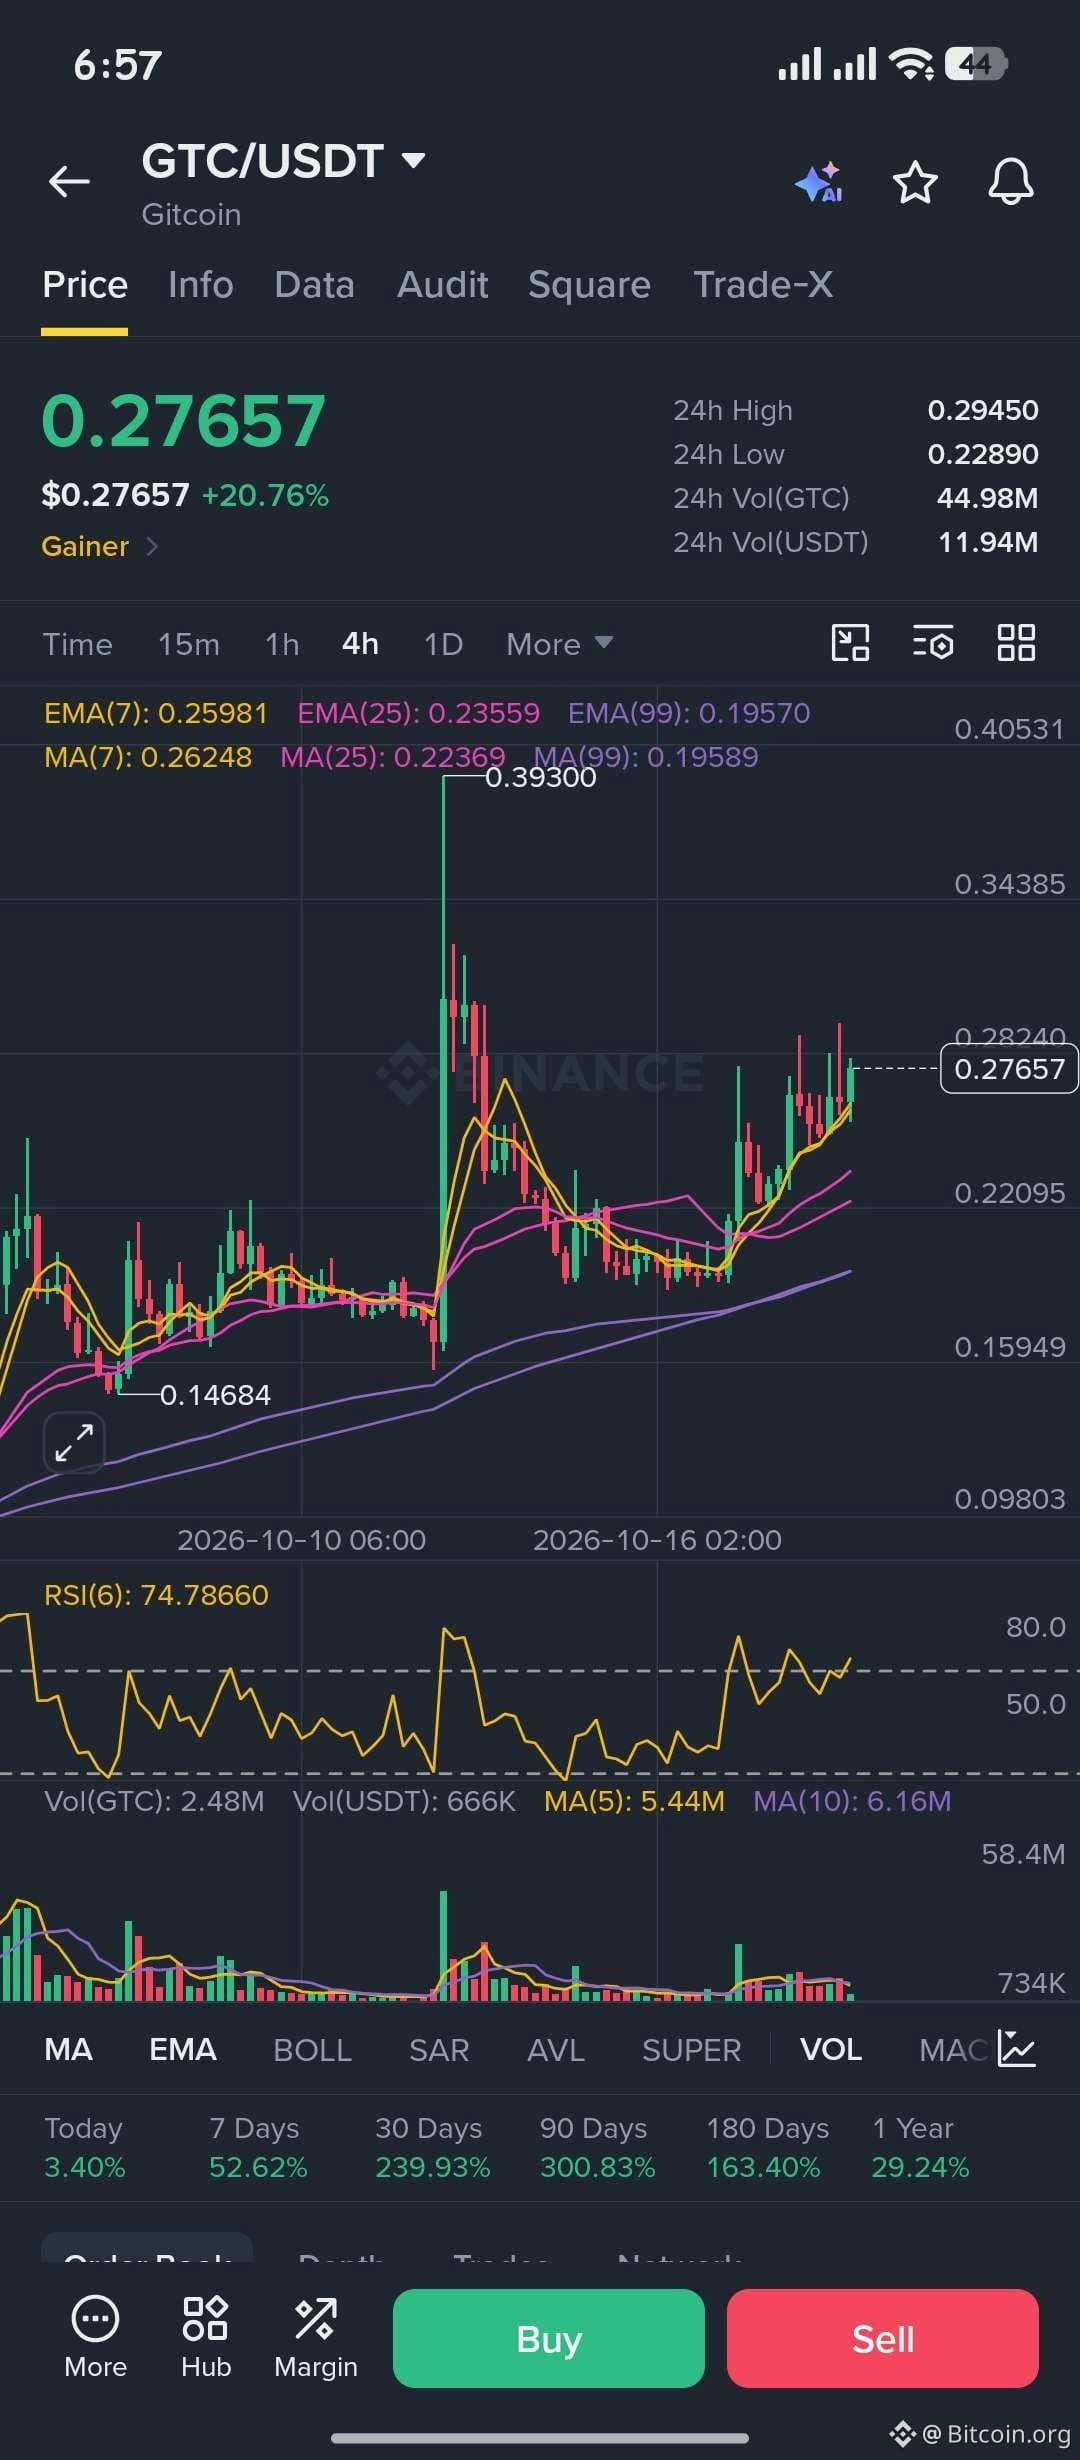
$GTC chart is messy right now, overlapping MAs, choppy wicks, but the structure underneath still favors the bulls.
Price at 0.27657, up 20.76%, holding above both the EMA(7) at 0.25981 and MA(7) at 0.26248, meaning short term momentum is still in control despite the noise. RSI(6) at 74.78, climbing again after cooling off mid chart, that pattern, hot, cool, hot again, usually means buyers keep stepping back in on dips instead of giving up.
Why it still looks bullish despite the mess: the broader moving average stack is clean even if price action isn't, MA(7) above MA(25) above MA(99), that's trend confirmation sitting underneath all that candle noise. Volume's real too, 44.98M GTC in 24h, not a thin chop.
Messy candles just mean indecision in the short term, the actual trend data, 52.62% this week, 300.83% over 90 days, says the bigger picture hasn't broken down. Watching if it clears 0.2945 clean, that resolves the mess either way.
$GTC