$BTC BTC/USDT (1h chart) – Quick Analysis
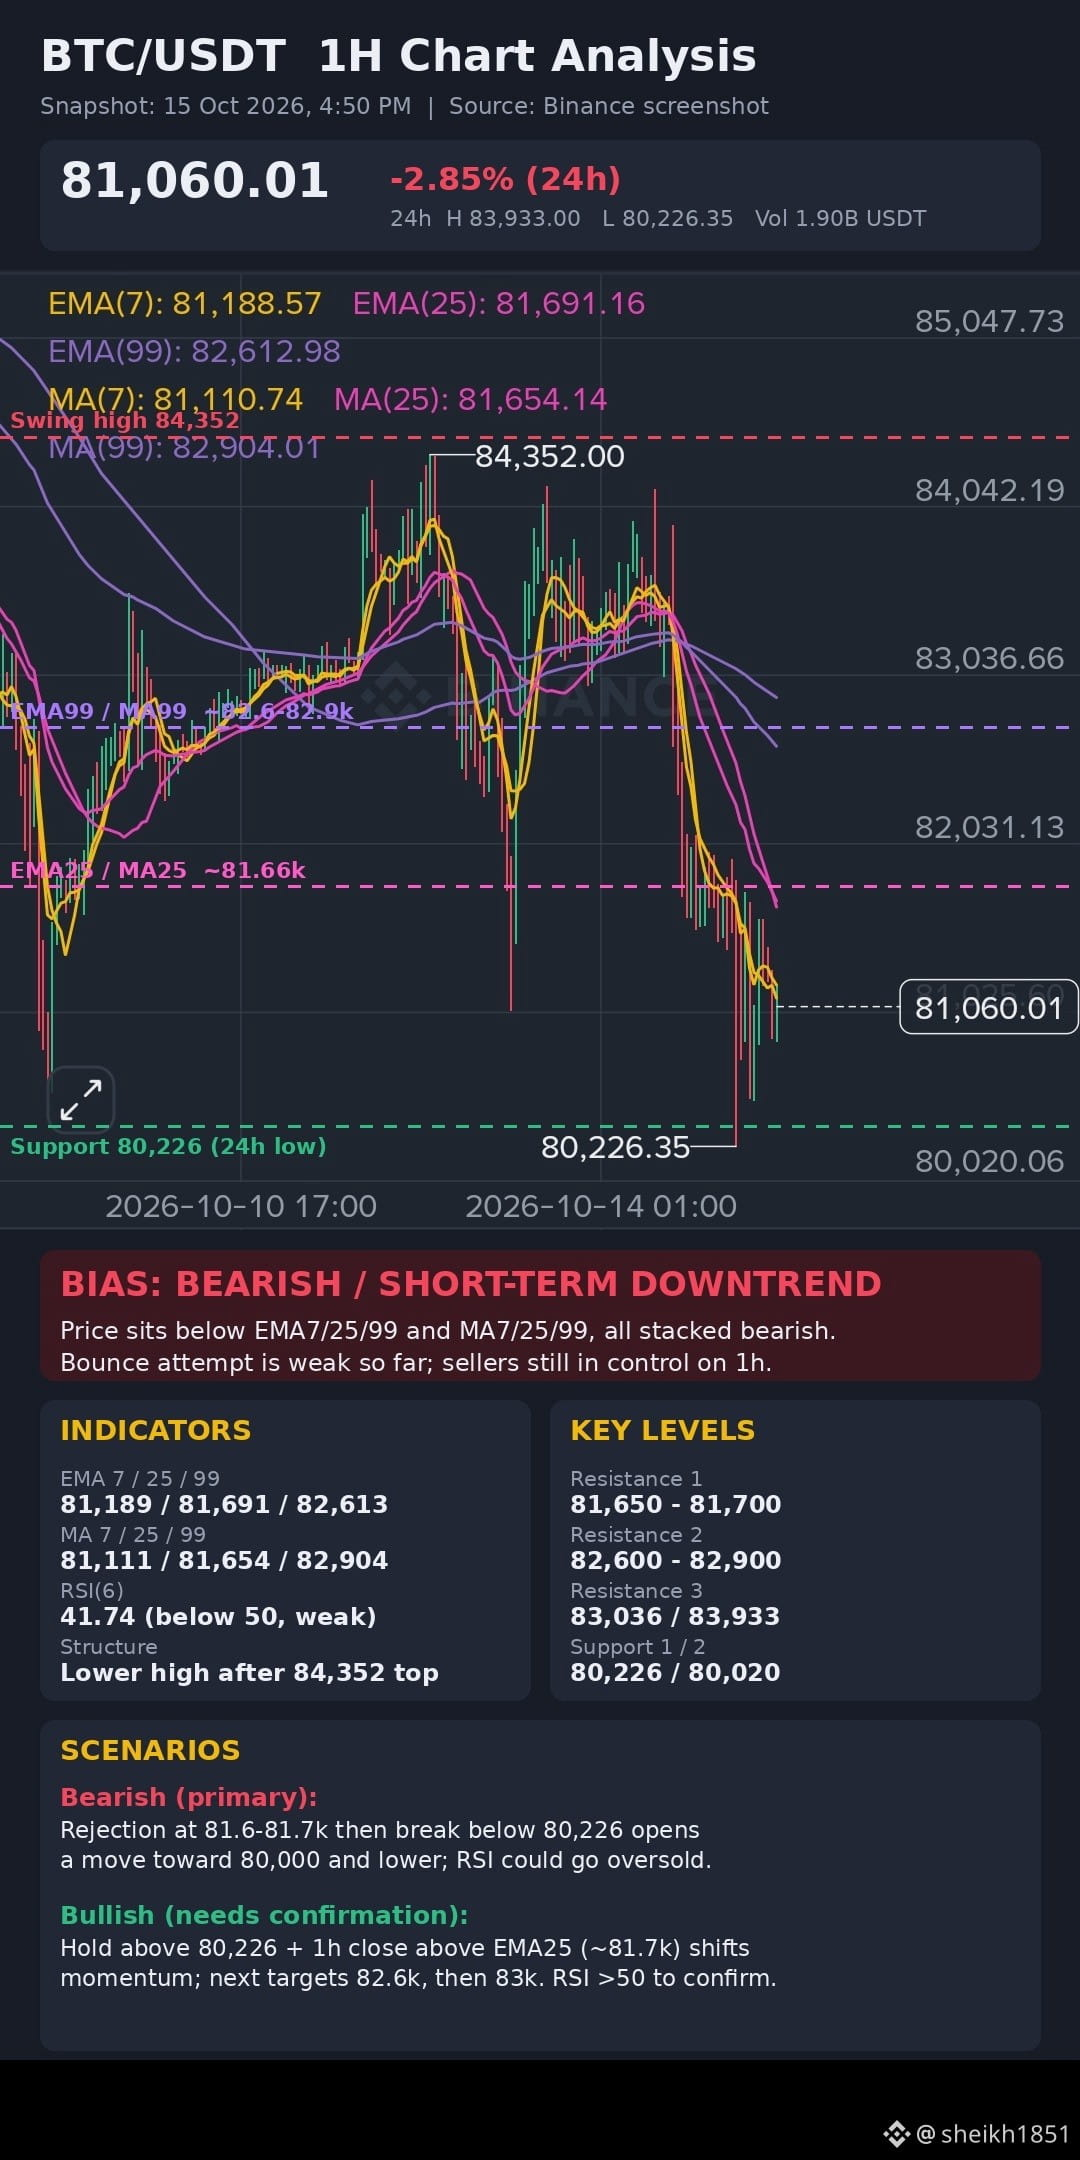
Snapshot: Price is 81,060, down 2.85% on the day. The 24h range is 80,226 to 83,933, so price is sitting in the lower part of it, about 1% above the 24h low.
Trend: Short-term bearish. After peaking near 84,352, price made a sharp drop and has stayed below all the key moving averages:
EMA(7): 81,188 and MA(7): 81,110 (price is just under these)
EMA(25): 81,691 / MA(25): 81,654
EMA(99): 82,613 / MA(99): 82,904
The shorter averages are sloping down and the 7 is below the 25, which is a bearish alignment. The 99-period lines are well above price and act as heavy overhead resistance.
Momentum: RSI(6) is 41.74, which is weak but not oversold. That leaves room for further downside before a bounce signal, though RSI has been choppy and has just ticked up slightly from the lows.
Key levels:
Support: 80,226 (recent low), then about 80,000 as a psychological level
Resistance: 81,650 to 81,700 (EMA/MA 25), then 82,600 to 82,900 (99-period lines), then 84,350 (recent high)
Higher-timeframe context: 7-day is -2.83%, 30-day is +2.34%, 90-day is +26.17%, 180-day is +5.04%, and 1-year is -28.19%. So the medium-term picture is positive, but the past week has been a pullback.
Outlook:
Bearish case: A break and close below 80,226 could open a move toward 80,000 and lower.
Bullish case: A reclaim of 81,700 (the 25-period averages) would suggest the selloff is stalling, with 82,600 as the next test.
Until one of those happens, expect choppy, range-bound action with a downward bias.
This is a technical read not financial advice. Crypto is highly volatile, so use stop-losses and manage risk, and check higher timeframes (4h/1D) before acting.
#CPIWatch #BTC☀
Snapshot: Price is 81,060, down 2.85% on the day. The 24h range is 80,226 to 83,933, so price is sitting in the lower part of it, about 1% above the 24h low.
Trend: Short-term bearish. After peaking near 84,352, price made a sharp drop and has stayed below all the key moving averages:
EMA(7): 81,188 and MA(7): 81,110 (price is just under these)
EMA(25): 81,691 / MA(25): 81,654
EMA(99): 82,613 / MA(99): 82,904
The shorter averages are sloping down and the 7 is below the 25, which is a bearish alignment. The 99-period lines are well above price and act as heavy overhead resistance.
Momentum: RSI(6) is 41.74, which is weak but not oversold. That leaves room for further downside before a bounce signal, though RSI has been choppy and has just ticked up slightly from the lows.
Key levels:
Support: 80,226 (recent low), then about 80,000 as a psychological level
Resistance: 81,650 to 81,700 (EMA/MA 25), then 82,600 to 82,900 (99-period lines), then 84,350 (recent high)
Higher-timeframe context: 7-day is -2.83%, 30-day is +2.34%, 90-day is +26.17%, 180-day is +5.04%, and 1-year is -28.19%. So the medium-term picture is positive, but the past week has been a pullback.
Outlook:
Bearish case: A break and close below 80,226 could open a move toward 80,000 and lower.
Bullish case: A reclaim of 81,700 (the 25-period averages) would suggest the selloff is stalling, with 82,600 as the next test.
Until one of those happens, expect choppy, range-bound action with a downward bias.
This is a technical read not financial advice. Crypto is highly volatile, so use stop-losses and manage risk, and check higher timeframes (4h/1D) before acting.
#CPIWatch #BTC☀