



Current Price: 0.0430 USDT
24H Change: Approximately +6%
24H High: 0.0540 | 24H Low: 0.0375
OSMO is showing signs of recovery, but can bullish momentum continue? Let’s analyze the available timeframes.
⏱️ 15-MINUTE (15M) — Short-Term Momentum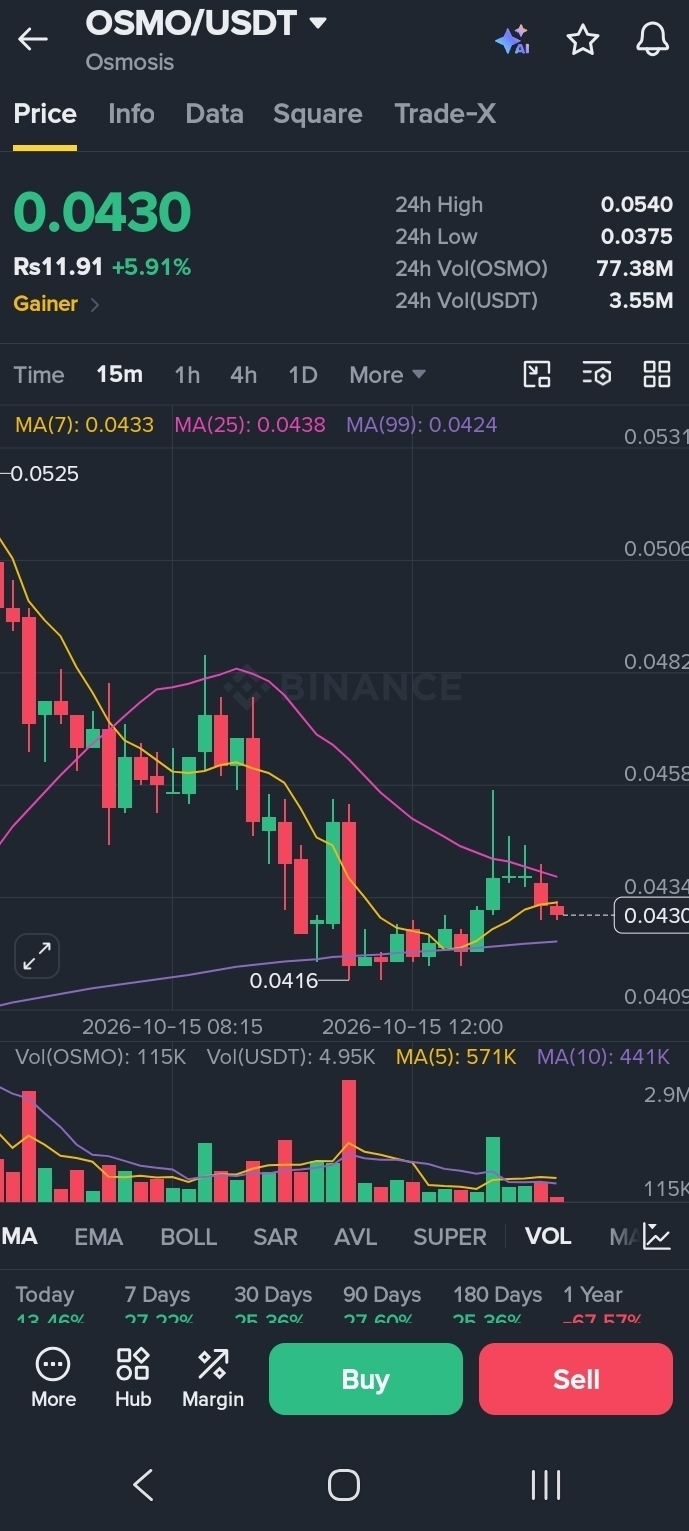
MA(7): 0.0433
MA(25): 0.0438
MA(99): 0.0424
Price is near the short-term moving averages, indicating that immediate momentum needs confirmation. A strong candle close above 0.0438–0.0445 could strengthen the bullish setup.
⏱️ 1-HOUR (1H) — Resistance Test
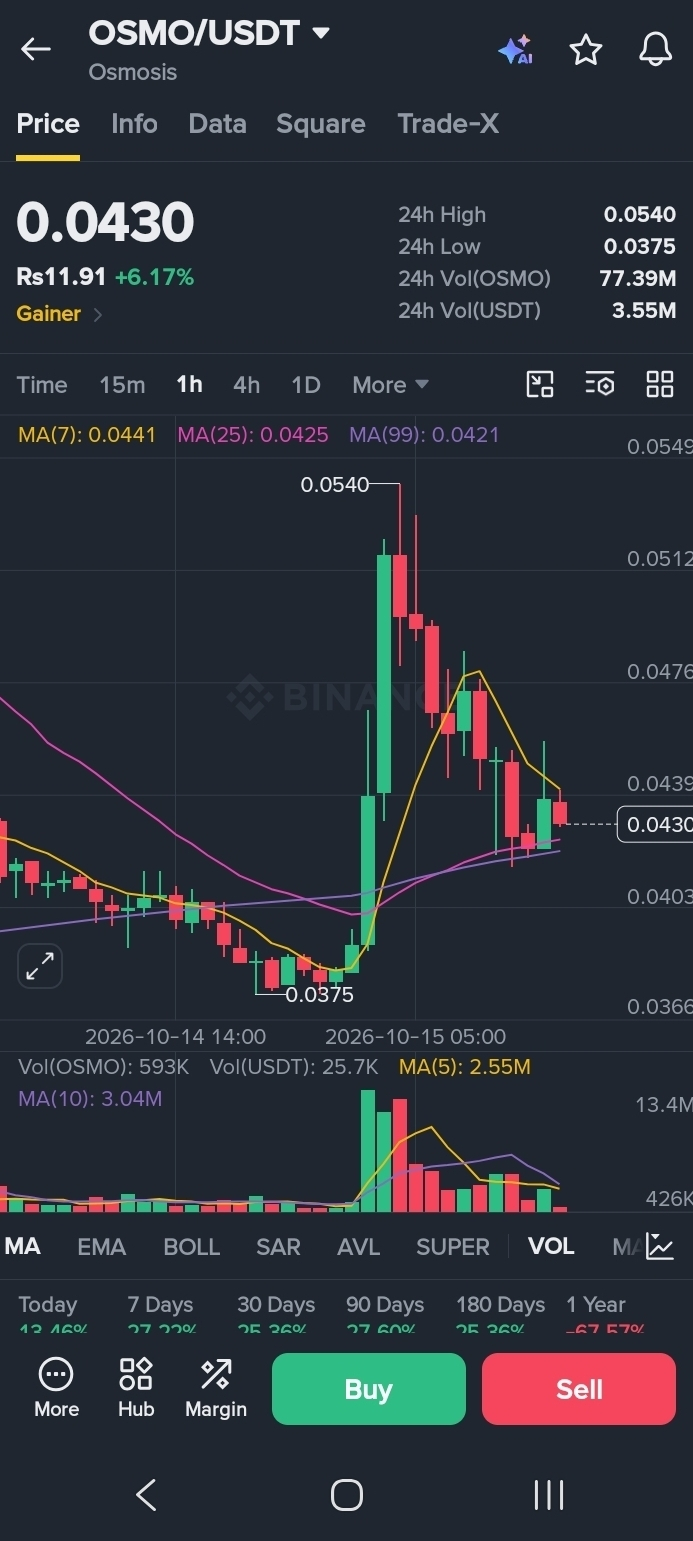
MA(7): 0.0441
MA(25): 0.0425
MA(99): 0.0421
Price remains below MA(7), suggesting short-term resistance. A sustained move above 0.0441 could improve momentum, while 0.0425–0.0421 is an important support area to watch.
⏱️ 4-HOUR (4H) — Recovery Structure
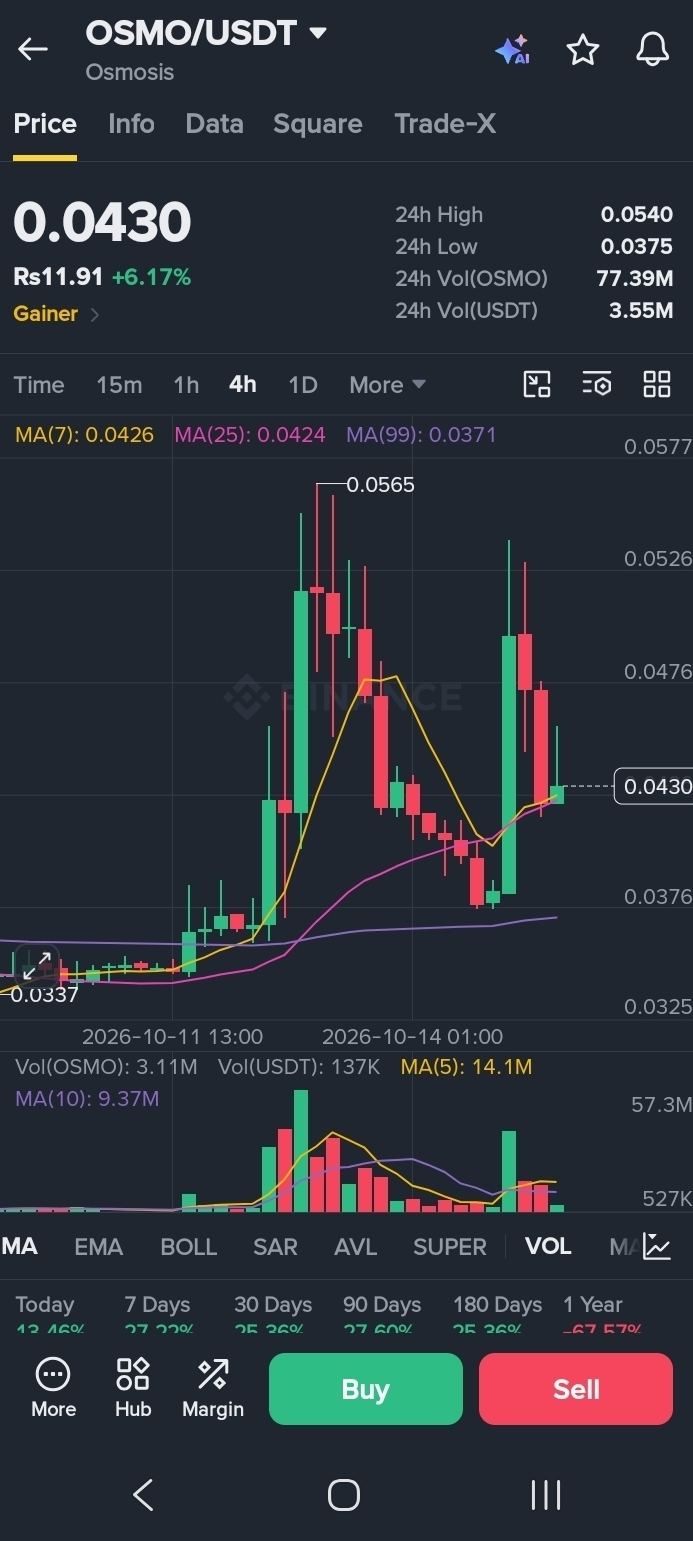
MA(7): 0.0426
MA(25): 0.0424
MA(99): 0.0371
Price is above these displayed moving averages, suggesting a potentially constructive recovery structure. Holding above 0.0424–0.0426 may help buyers maintain control.
📅 1-DAY (1D) — Bullish Recovery Signal
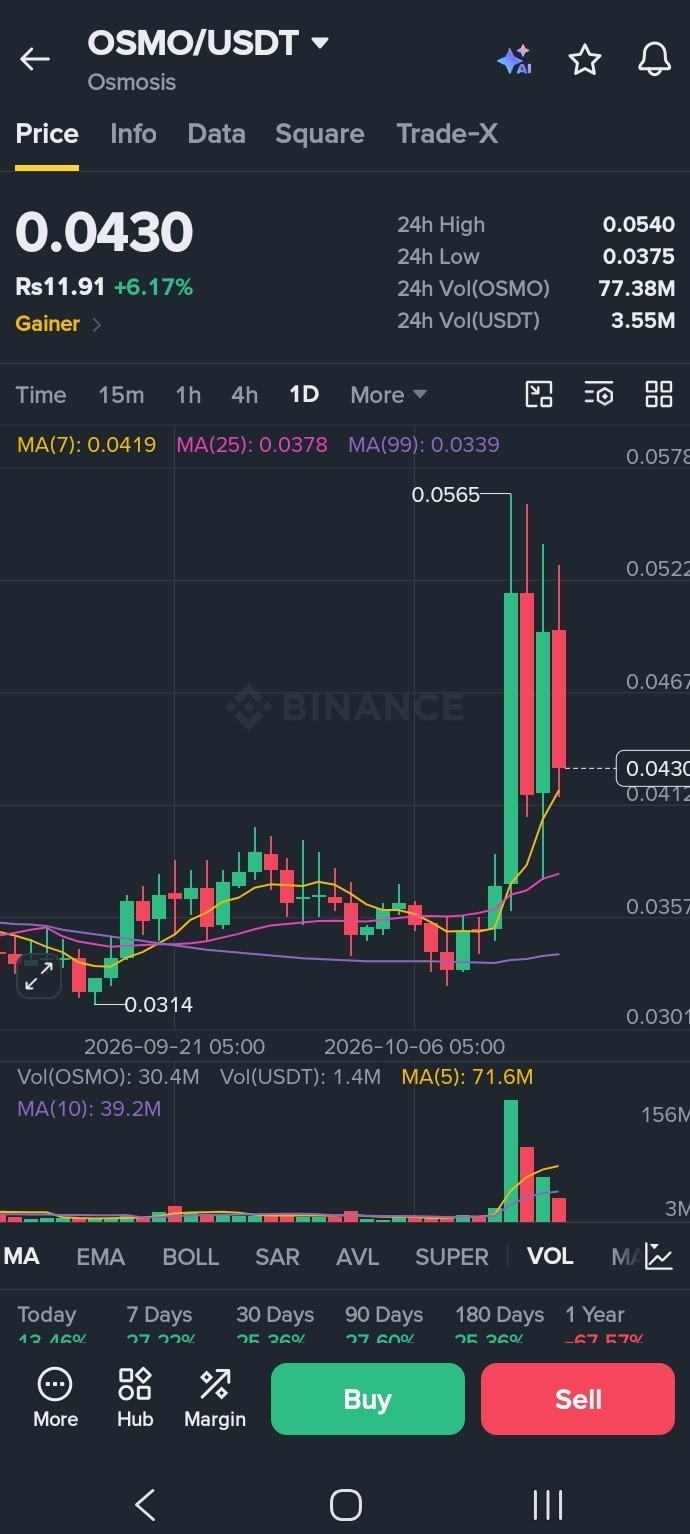
MA(7): 0.0419
MA(25): 0.0378
MA(99): 0.0339
The current price is above all three displayed moving averages. This supports the recovery outlook, although resistance and volume confirmation remain important.
🌍 1-WEEK (1W) — Bigger Picture
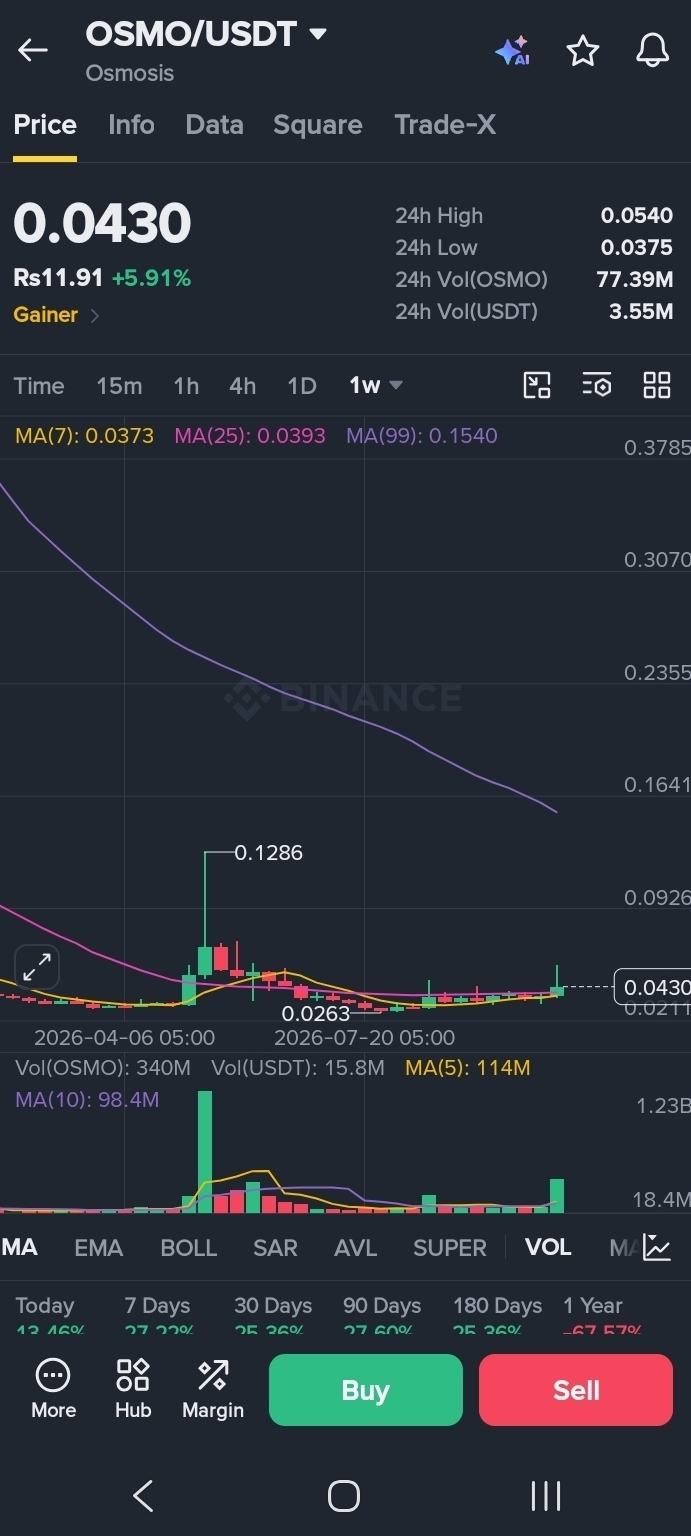
MA(7): 0.0373
MA(25): 0.0393
MA(99): 0.1540
The weekly picture is mixed. OSMO is above the displayed MA(7) and MA(25), but the MA(99) remains far higher. A sustained recovery is needed before calling this a confirmed long-term trend reversal.
🎯 Key Levels to Watch
Resistance: 0.0438–0.0445
Upside Targets: 0.0460 → 0.0475 → 0.0500
Support: 0.0425–0.0420
Lower Support: 0.0410–0.0400
Bullish Scenario: A confirmed breakout above 0.0445 with increasing volume could open the way toward the next resistance levels.
Bearish Scenario: A breakdown below 0.0420 could weaken the recovery and expose lower support zones.
🧠 Final Verdict
OSMO/USDT is showing encouraging recovery signals on the 4H and 1D timeframes, while the 15M and 1H charts need stronger bullish confirmation. The 1W timeframe still requires caution.
Avoid chasing a green candle. Watch price action, volume, and candle closes before making a decision.
Disclaimer: This analysis is for educational purposes only, based on the provided chart screenshots. It is not financial advice. Cryptocurrency markets are volatile; always manage risk and do your own research.
#OSMO #Osmosis #OSMOUSDT #BinanceSquare #CryptoAnalysis #TechnicalAnalysis #Altcoins #CryptoTrading #PriceAction #CryptoMarket