#btc $BTC
BTC/USDT Chart Analysis + RSI 📊
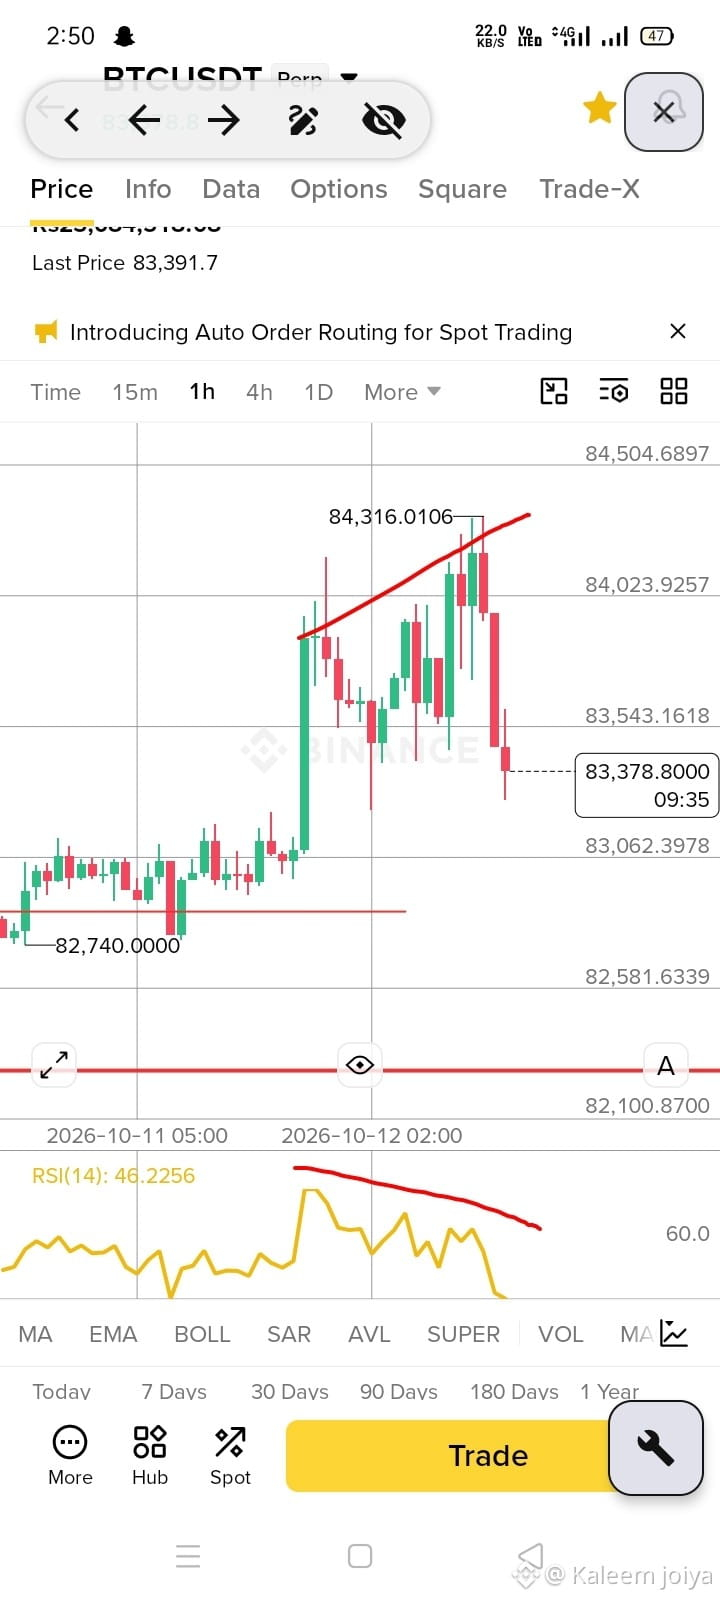
BTC/USDT recently made a strong bullish move toward the 84,316 resistance zone.
Price faced rejection near the upper trendline, indicating possible selling pressure.
. The latest bearish candles suggest that short-term momentum is weakening.
. The 83,543 level is an important nearby support to watch.
If price breaks below this support, further downside may follow.
RSI(14) is around 46.22, showing weakening bullish momentum.
. RSI has also dropped below the 50 level, suggesting sellers are gaining strength.
The falling RSI trend supports the possibility of continued short-term correction.
A recovery above resistance with stronger RSI momentum could revive bullish sentiment.
Trade smart: Wait for confirmation and manage risk before taking any position.
Educational analysis only — not financial advice.
BTC/USDT Chart Analysis + RSI 📊
BTC/USDT recently made a strong bullish move toward the 84,316 resistance zone.
Price faced rejection near the upper trendline, indicating possible selling pressure.
. The latest bearish candles suggest that short-term momentum is weakening.
. The 83,543 level is an important nearby support to watch.
If price breaks below this support, further downside may follow.
RSI(14) is around 46.22, showing weakening bullish momentum.
. RSI has also dropped below the 50 level, suggesting sellers are gaining strength.
The falling RSI trend supports the possibility of continued short-term correction.
A recovery above resistance with stronger RSI momentum could revive bullish sentiment.
Trade smart: Wait for confirmation and manage risk before taking any position.
Educational analysis only — not financial advice.