


Gitcoin (GTC) is showing early signs of a short-term recovery, with GTC/USDT trading around $0.17992, up approximately 1.01%–1.06% in the latest Binance screenshots.
However, a small price rebound does not automatically confirm a trend reversal. The key question is whether buyers can push GTC above its nearby moving-average resistance levels.
📊 15-Minute Chart: Short-Term Recovery
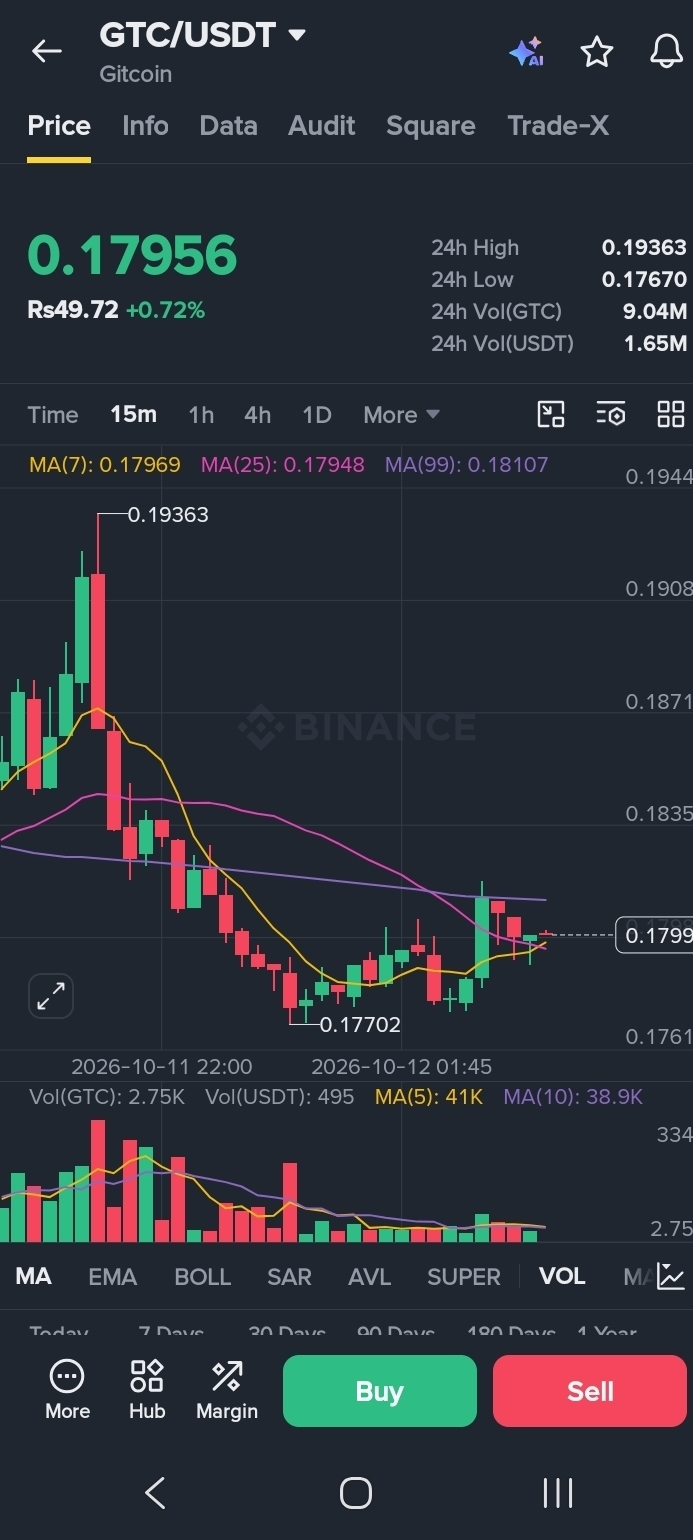
The 15-minute chart shows GTC trading above its short-term moving averages:
MA(7): $0.17969
MA(25): $0.17948
MA(99): $0.18107
Price is holding above MA(7) and MA(25), suggesting improving short-term momentum. However, the MA(99) near $0.18107 remains an important hurdle. A sustained move above this level could strengthen the recovery attempt.
⏱️ 1-Hour Chart: Resistance Still Matters
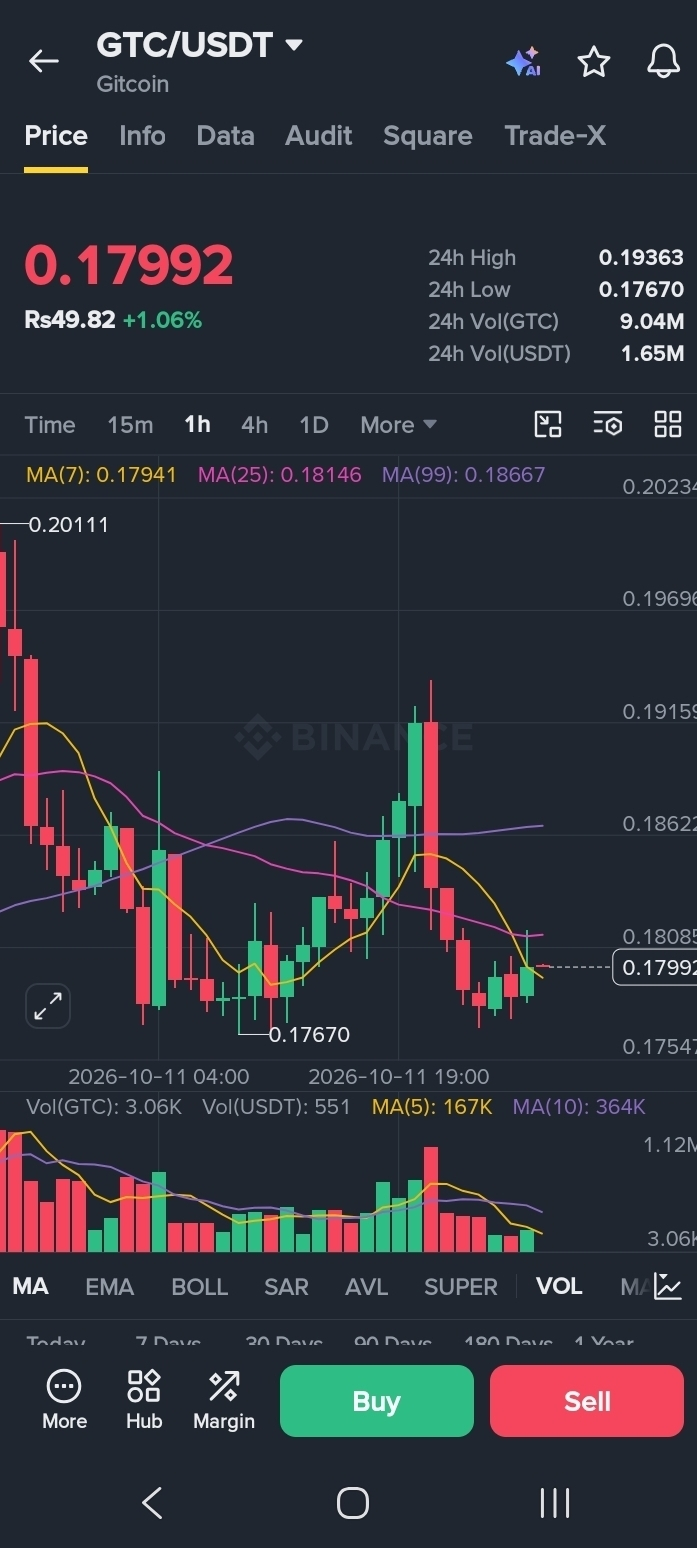
The 1-hour chart presents a more cautious picture:
MA(7): $0.17941
MA(25): $0.18146
MA(99): $0.18667
GTC is above MA(7), but remains below MA(25) and MA(99). This means the short-term bounce has not yet confirmed a stronger bullish reversal.
📅 Daily Chart: Recovery or Pullback?
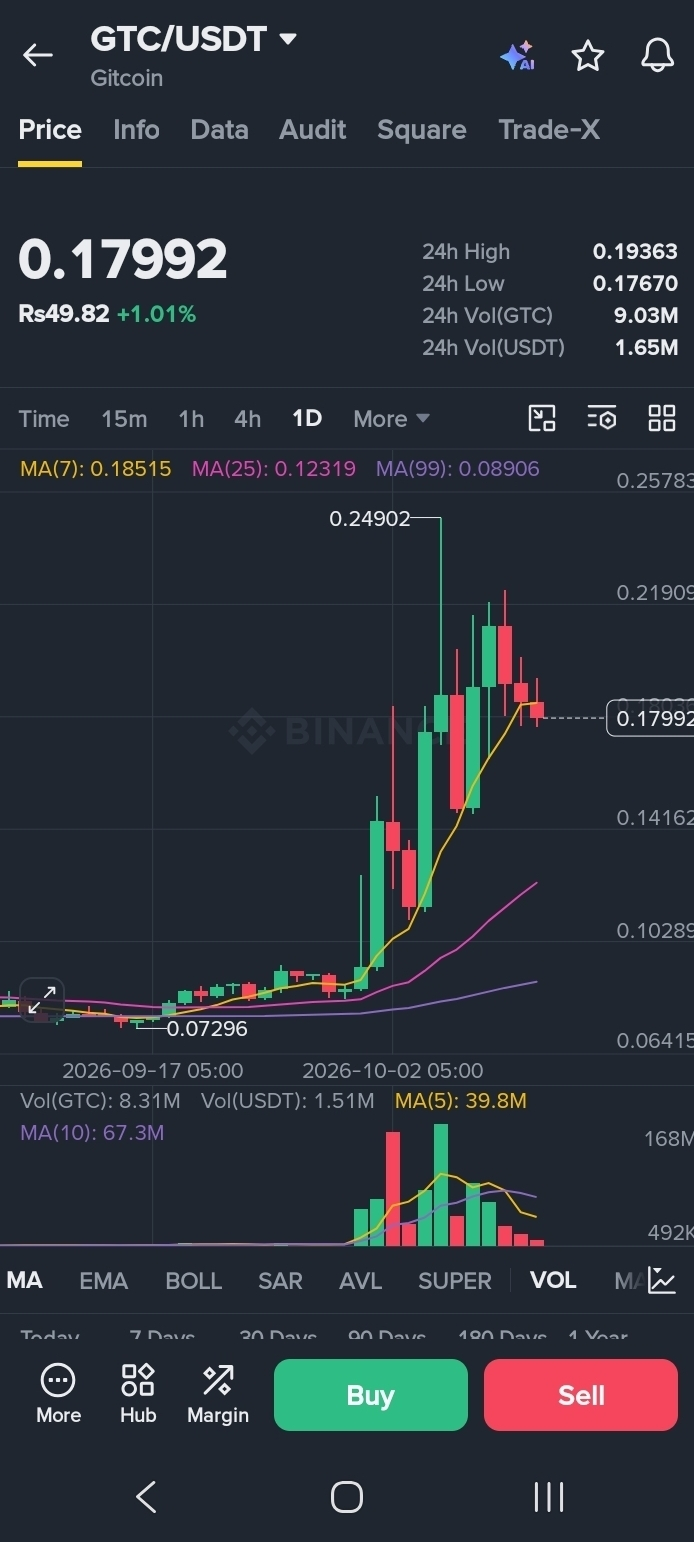
The daily chart shows:
MA(7): $0.18515
MA(25): $0.12319
MA(99): $0.08906
GTC remains above its MA(25) and MA(99), but trades below MA(7). This suggests that the market is recovering from a significant earlier rally while still facing the possibility of further consolidation.
🎯 Key Levels to Watch
Resistance levels
$0.18107–$0.18146: First resistance zone
$0.18350: Next potential hurdle
$0.18622–$0.18667: Stronger resistance zone
Support levels
$0.17940–$0.17950: Near-term support area
$0.17702: Additional support
$0.17670: Recent 24-hour low
🚀 What Could Happen Next?
Bullish scenario: If GTC breaks above $0.18146 with stronger trading volume and holds the level, the price could attempt to move toward $0.18350 and then $0.18620.
Bearish scenario: If GTC fails to clear resistance and falls below $0.17940, selling pressure could bring $0.17702–$0.17670 back into focus.
These are conditional scenarios, not guaranteed price targets.
💡 Final Takeaway
GTC is showing a modest short-term recovery, but confirmation is still needed. The $0.18107–$0.18146 zone is the immediate area to watch. A convincing breakout supported by volume would improve the bullish case, while rejection could lead to further consolidation.
Disclaimer: This article is for educational and informational purposes only and is not financial advice. Cryptocurrency markets are volatile. Always conduct your own research and manage risk before trading.
#GTC #Gitcoin #GTCUSDT #CryptoAnalysis #TechnicalAnalysis #BinanceSquare #Altcoins #CryptoMarket