


iExec RLC (RLC) is showing renewed bullish momentum, with RLC/USDT trading around $1.0468, up approximately 8.23% in the 24-hour period shown in the Binance screenshots.
But after a strong recovery, the next move depends on whether buyers can overcome resistance or sellers step in to take profits.
📊 1H Chart: Buyers Need to Hold Support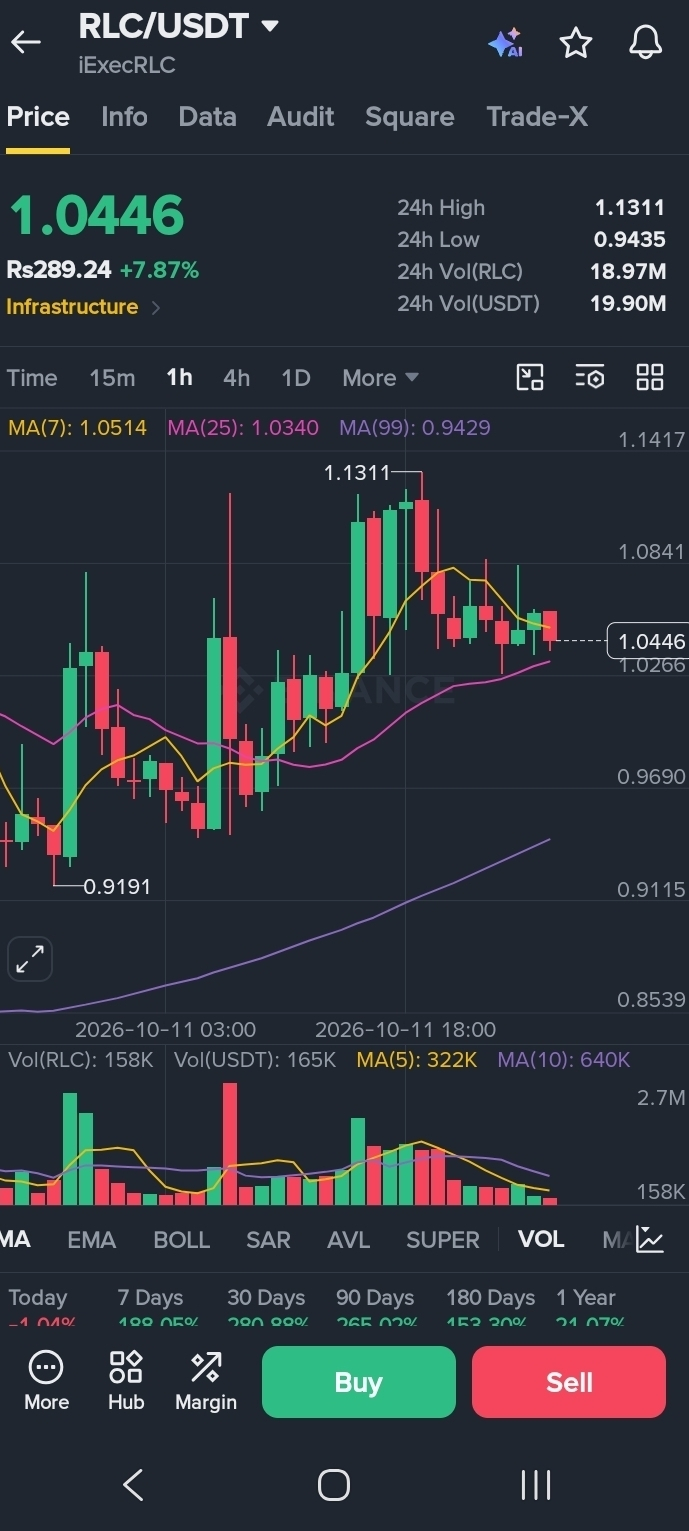
The 1-hour chart shows:
Price: $1.0468
MA(7): $1.0514
MA(25): $1.0340
MA(99): $0.9429
RLC is slightly below its short-term MA(7), while remaining above its MA(25). This suggests that the immediate momentum is mixed rather than a confirmed fresh breakout.
The $1.0340–$1.0266 area is worth watching for a potential support reaction.
📈 1D Chart: Bullish Structure, but Caution Matters
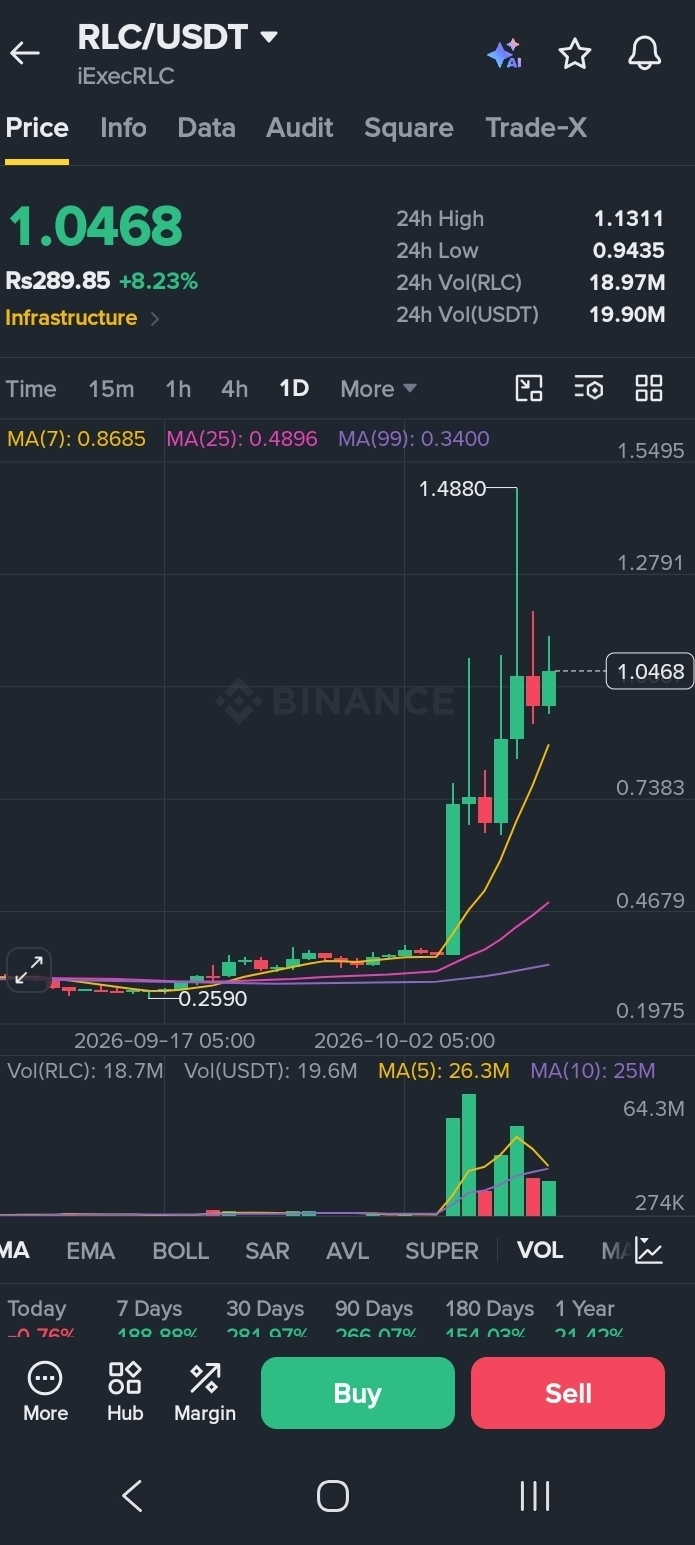
The daily chart shows RLC trading well above its moving averages:
MA(7): $0.8685
MA(25): $0.4896
MA(99): $0.3400
This reflects a strong recent recovery. However, the distance from these averages also highlights the possibility of volatility and profit-taking if buying pressure fades.
🎯 Key Levels to Watch
Resistance
$1.0841
$1.1311
$1.1417
Support
$1.0340
$1.0266
$0.9690
$0.9435
A sustained move above $1.0841, followed by a convincing break of $1.1311 with strong volume, could strengthen the bullish case.
If RLC loses the $1.0266 area, traders may instead watch for a deeper pullback toward $0.9690 and the $0.9435 area.
🔍 What Comes Next?
RLC has a bullish daily structure, but the 1-hour chart has not yet confirmed another breakout. The key is to watch price action and volume around resistance instead of chasing the rally.
My view: RLC is worth monitoring, but confirmation is more important than excitement.
Do you think RLC can break above $1.1311, or will sellers push it back toward support?
Disclaimer: This article is for educational and informational purposes only and is based on the supplied Binance screenshots. It is not financial advice. Cryptocurrency prices are volatile; always conduct your own research.
#RLC #iExecRLC #CryptoAnalysis #BinanceSquare #Altcoins #TechnicalAnalysis #CryptoMarket