

Starknet (STRK) is attracting attention after a powerful rally, but the big question is whether buyers can push the price higher or if a correction is approaching.
Based on the Binance chart screenshots, STRK/USDT is trading around $0.11585, with a reported 24-hour high of $0.12389 and low of $0.10052. The broader move is bullish, but short-term resistance needs close attention.
📊 1H Chart: Momentum Faces a Test
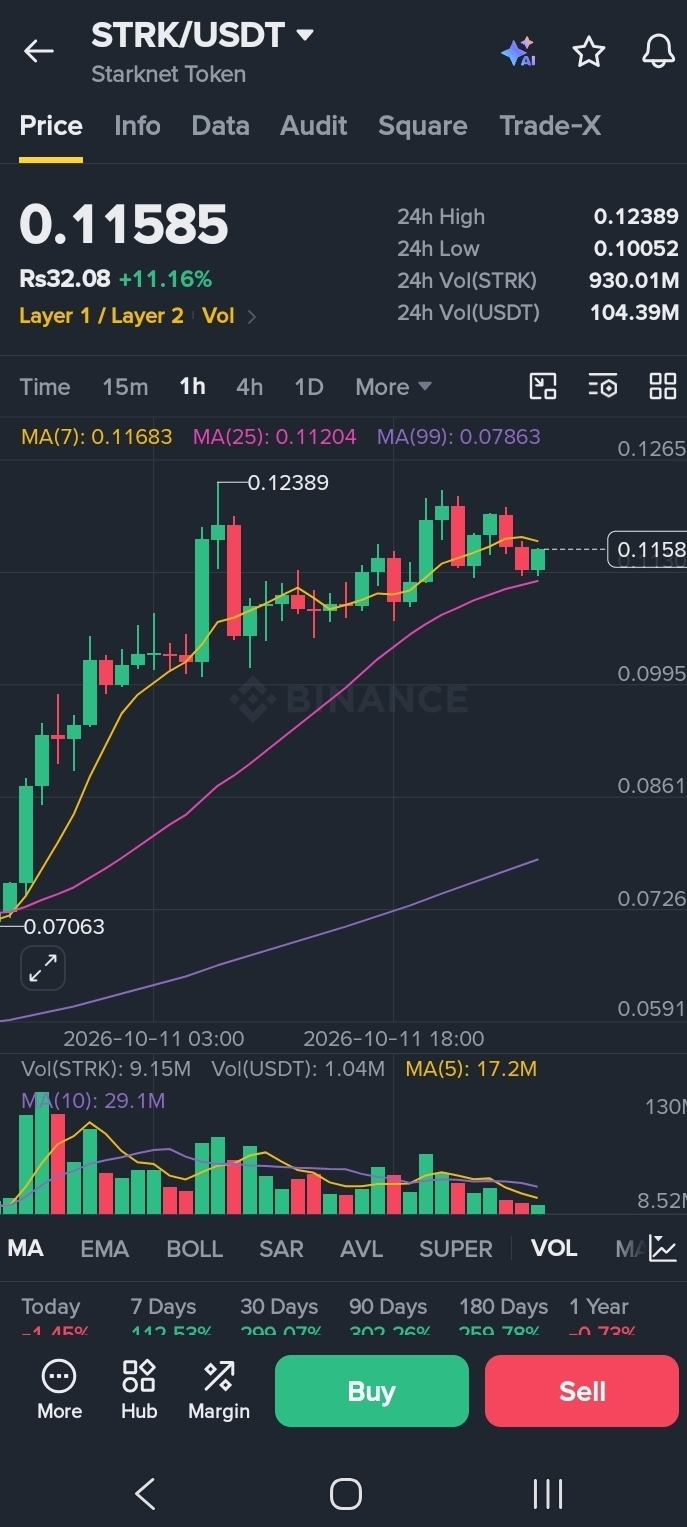
On the 1-hour chart:
Price: $0.11585
MA(7): $0.11683
MA(25): $0.11204
MA(99): $0.07863
STRK is trading slightly below its short-term MA(7), suggesting that immediate momentum may be cooling. However, price remains above the MA(25), keeping the possibility of another upward move alive if buyers return.
📈 1D Chart: Strong Recovery, Higher Risk
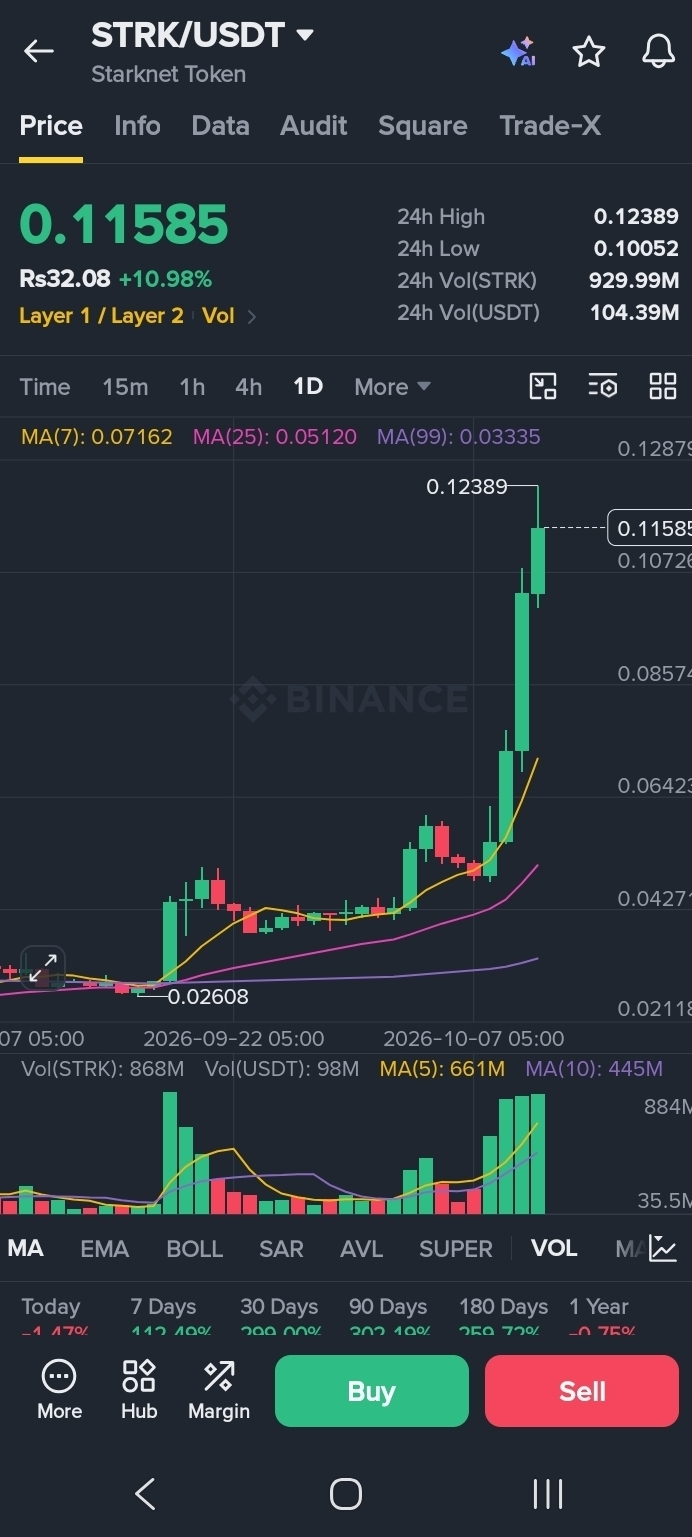
The daily chart shows a much stronger trend:
MA(7): $0.07162
MA(25): $0.05120
MA(99): $0.03335
Price is significantly above all three moving averages. This reflects strong recent upside momentum, but it also means traders should be alert to profit-taking and sharp pullbacks after the rally.
🎯 Key STRK Price Levels to Watch
Resistance zone:
$0.12389 — recent 24-hour high
$0.12650–$0.12880 — potential next resistance zone
Support zone:
$0.11200 — near the 1H MA(25)
$0.10730 — potential pullback area
$0.10052 — recent 24-hour low
A convincing breakout above $0.12389, supported by strong trading volume and a successful retest, could open the door to another upward move.
On the other hand, losing the $0.11200 area could increase the possibility of a deeper pullback toward lower support levels.
🔍 What Comes Next for STRK?
The daily trend remains strong, but the 1-hour chart suggests that buyers need to regain short-term momentum. Rather than chasing a rapidly rising price, traders can watch for a confirmed breakout or a controlled pullback with clear support.
My view: STRK is worth watching, but confirmation matters more than excitement. Volume, candle closes, and the reaction around resistance will help determine whether the rally can continue.
What do you think? Will STRK break above $0.12389, or will sellers trigger a correction first? Share your view in the comments.
Disclaimer: This article is for informational and educational purposes only, based on the supplied Binance chart screenshots. It is not financial advice. Cryptocurrency markets are volatile, and every trader should conduct independent research before making decisions.
#STRK #Starknet #CryptoAnalysis #BinanceSquare #Altcoins #TechnicalAnalysis #CryptoMarket