

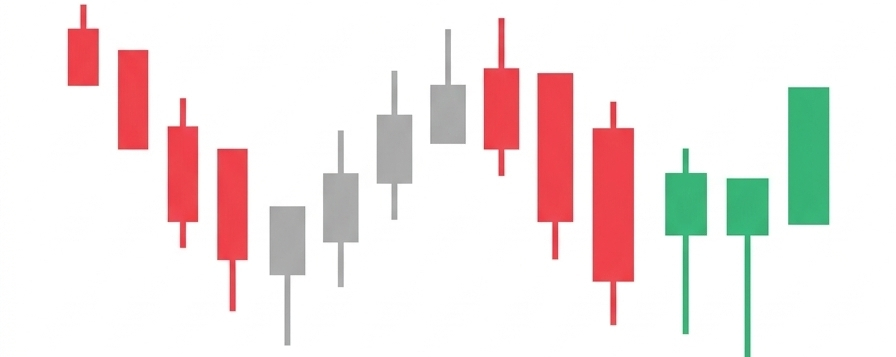

📊Pattern Name: Hammer. This is primarily a strong Bullish Reversal candlestick pattern, which appears after a decline or downtrend and signals a potential price recovery.
Win Rate: 84.48%. According to the screener's data, the market successfully reversed (turned bullish) in 84.48% of cases after this pattern appeared.
Avg Return: 5.41%. Trading based on this signal yielded an average profit of 5.41% per trade.
Market Option: This is taken from the Crypto-Spot market candle screener, where this pattern is currently active across 331 coins. It is also visible in the Crypto-Perp and Stock-Spot markets.
🔍 Trading Psychology Behind the Hammer Pattern
Seller Aggression: Sellers actively push the price significantly lower during the early part of the trading session.
Buyer Comeback: However, buyers step in heavily at the lower price levels, rejecting the sellers and pushing the price back up near the opening level.
Anatomy: This creates a small real body at the top and a long lower shadow (or wick) at the bottom—making it look exactly like a hammer. This long lower shadow proves that the market is rejecting lower price levels.
🛠️ How to Trade the Hammer Pattern Safely
Even though the screener shows an 84.48% win rate, it is crucial to follow these rules for safer real-market execution:
Confirmation Candle: It is safe to enter a trade (Buy Entry) only if the candle immediately following the hammer breaks above the hammer's high and closes there.
Stop Loss: To minimize risk, always place your stop loss just below the lowest wick or low of the hammer candle.
Check Support Zone: The effectiveness of the hammer increases significantly if it forms on a strong horizontal support level or a key moving average.