

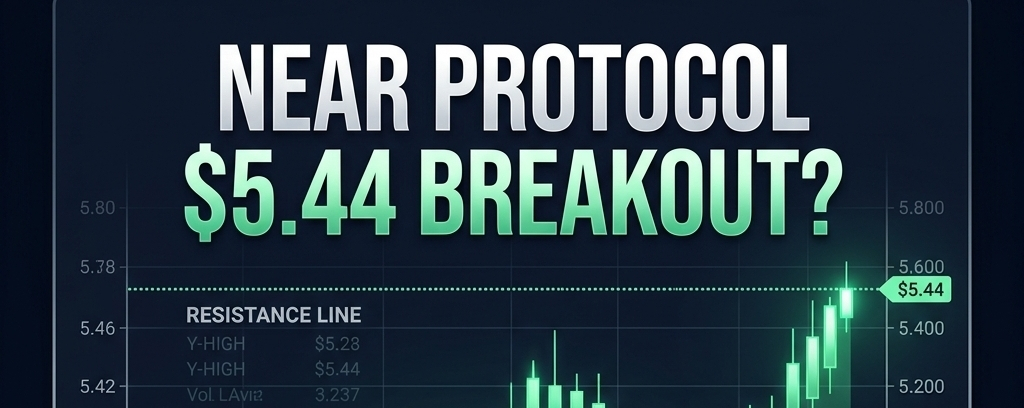

NEAR Protocol (NEAR) is showing strong momentum, trading around $5.365 after gaining approximately 12.33% in 24 hours, according to the latest Binance screenshots.
With 24-hour trading volume reaching approximately $147.21 million, market activity is worth watching closely. However, after a sharp rally, the key question is whether buyers can sustain the momentum or whether profit-taking will trigger a pullback.
📊 1H Chart: Short-Term Momentum Remains Positive
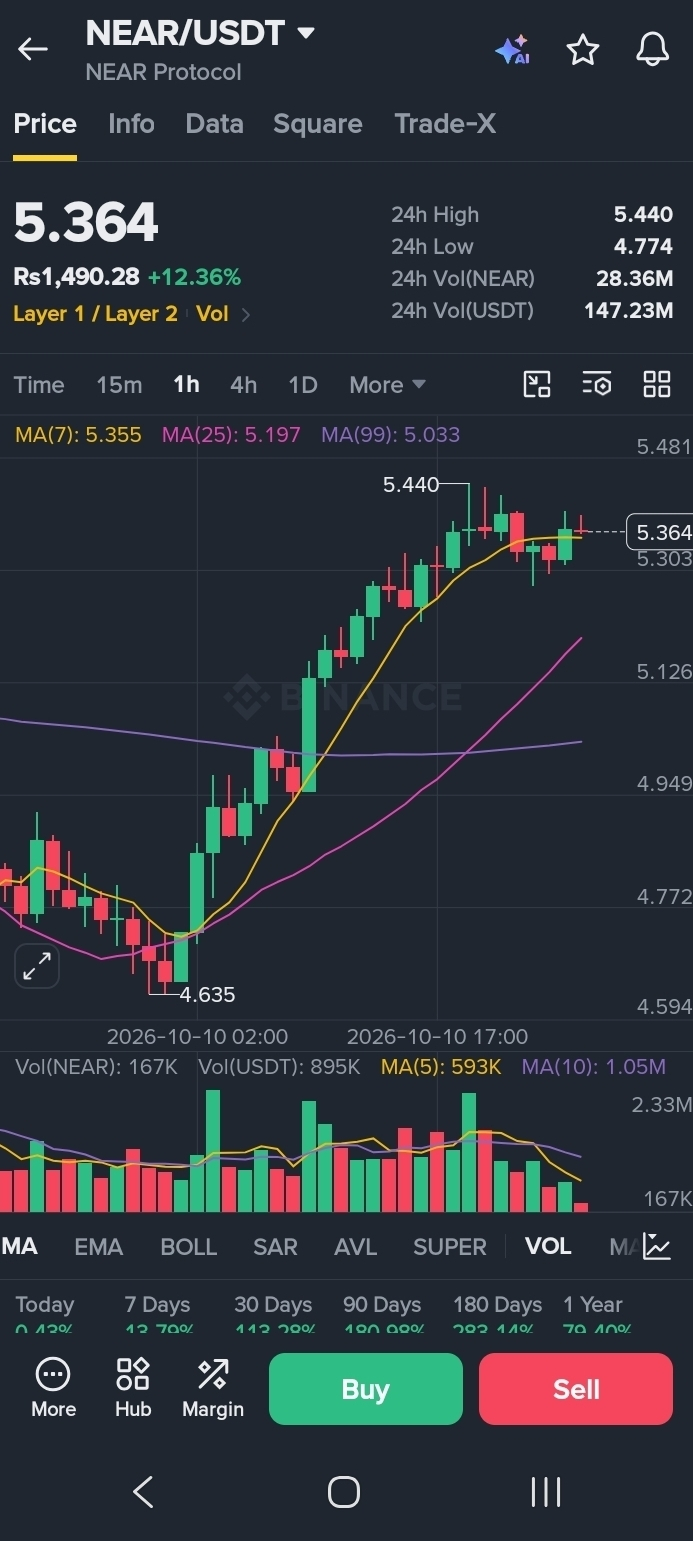
The 1-hour chart shows NEAR trading above its key moving averages:
MA(7): $5.355
MA(25): $5.197
MA(99): $5.033
This alignment supports a positive short-term structure. However, the price is trading close to the MA(7), so maintaining momentum will be important.
The immediate resistance zone is $5.440–$5.481. A sustained candle close above this area, accompanied by stronger volume, could improve the breakout scenario.
If buyers fail to overcome resistance, NEAR may consolidate or retrace toward nearby support.
📈 1D Chart: Recovery Structure Strengthens
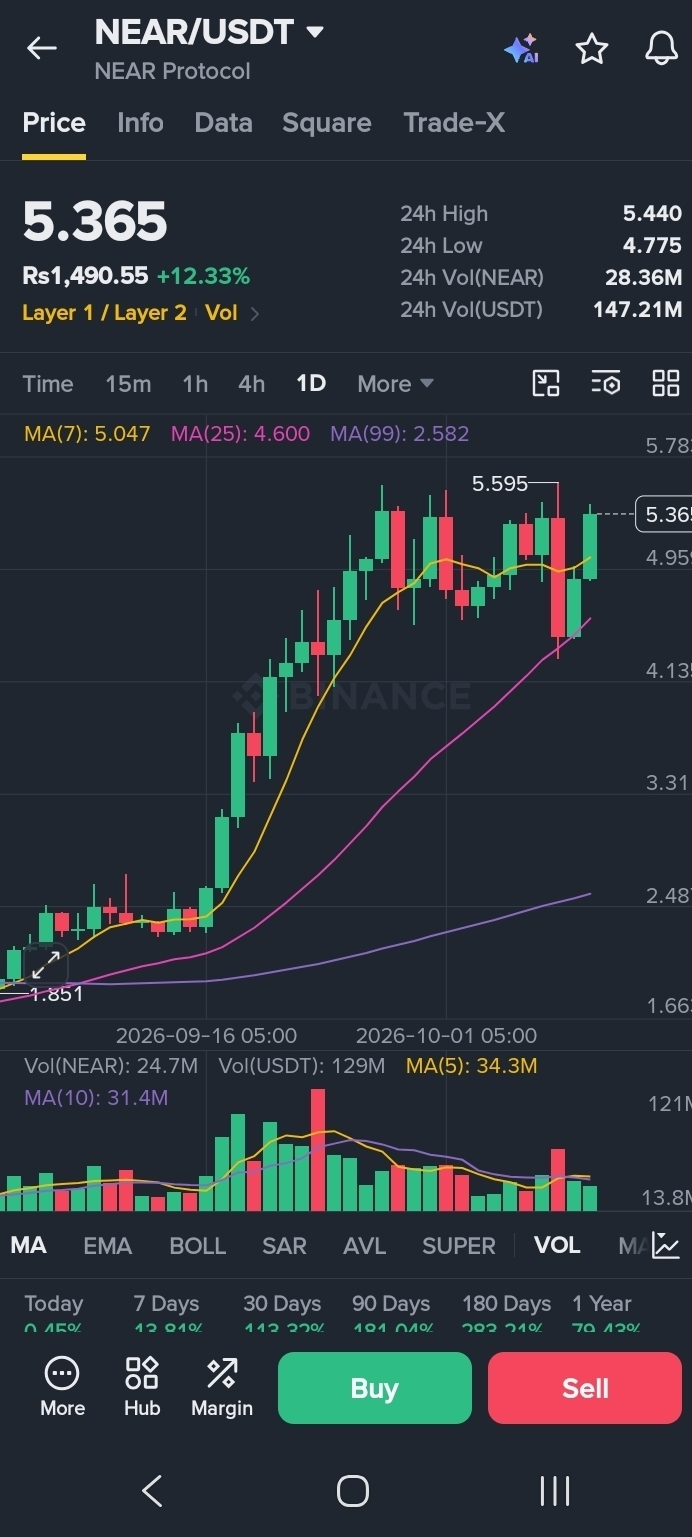
The daily chart also shows a constructive setup:
MA(7): $5.047
MA(25): $4.600
MA(99): $2.582
NEAR is trading above all three moving averages shown in the supplied screenshot. This supports the current recovery structure, although moving averages alone cannot guarantee that the rally will continue.
After the recent advance, traders should watch whether price can hold above the shorter-term support zones.
🎯 Key Price Levels to Watch
Resistance zones
$5.440–$5.481: Immediate breakout test
$5.595–$5.783: Potential next resistance area
Support zones
$5.30–$5.35: Near-term area to monitor
$5.197–$5.047: Moving-average support zone
$4.95–$4.775: Lower potential support area
These are chart-based reference zones, not guaranteed targets.
🔍 Three Possible Scenarios
Bullish scenario: If NEAR breaks above $5.481 and holds that level with stronger trading volume, the $5.595–$5.783 area could come into focus.
Consolidation scenario: If price remains below resistance but holds nearby support, NEAR may move sideways while the market establishes its next direction.
Bearish scenario: A rejection near resistance followed by a break below the $5.30 area could increase the likelihood of a deeper pullback toward the moving-average zone.
📝 Final Thoughts
NEAR Protocol's latest chart shows strong short-term momentum and a constructive daily structure. Nevertheless, a double-digit daily gain can also increase volatility and profit-taking risk.
For now, $5.44–$5.48 is the key zone to watch. A confirmed breakout could strengthen the bullish case, while a rejection would make support levels increasingly important.
The next move should be assessed through candle closes, volume and price behavior around these zones rather than the daily percentage gain alone.
Disclaimer: This article is for informational and educational purposes only and is not financial advice. The analysis is based on the supplied Binance chart screenshots and may become outdated as market conditions change. Always conduct your own research and manage risk carefully.
Hashtags
#NEAR #NEARProtocol #CryptoAnalysis #BinanceSquare #TechnicalAnalysis #CryptoMarket