


Cosmos (ATOM) is making a strong move, with ATOM/USDT perpetual futures trading around $2.033, up 18.34% in 24 hours in the provided Binance screenshots.
The rally looks strong across both the 1-hour (1H) and daily (1D) timeframes. However, ATOM is approaching an important resistance zone that could determine its next move.
📊 1H CHART ANALYSIS — Short-Term Momentum
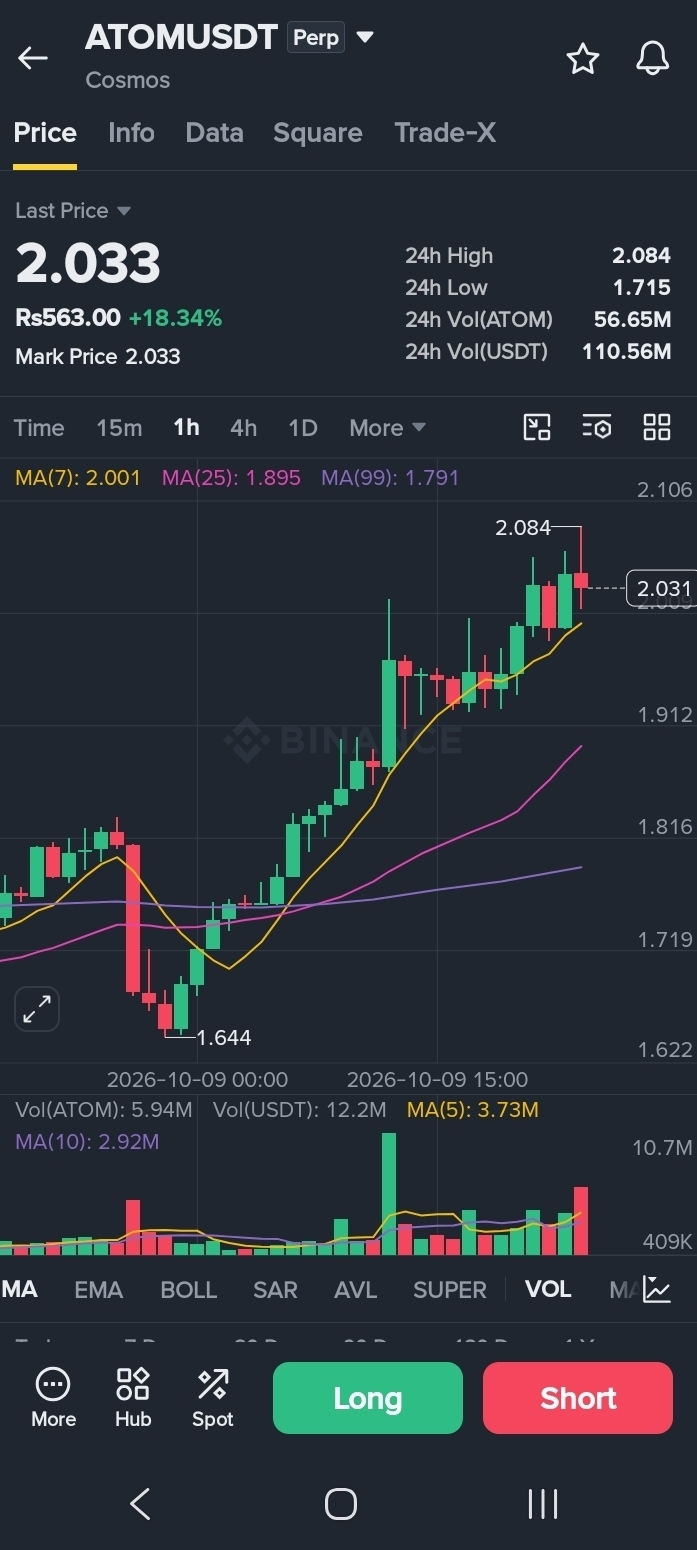
Price: $2.033
The 1H chart shows ATOM trading above its displayed moving averages:
MA(7): $2.001
MA(25): $1.895
MA(99): $1.791
This moving-average structure supports a bullish short-term trend. Price holding above $2.00 would help maintain the current momentum.
Key 1H levels:
Resistance: $2.084
Support: $2.00–$1.97
Lower support: $1.90
A sustained break above $2.084, supported by volume, could open the way toward the $2.10–$2.117 zone. Failure to hold near-term support could trigger a pullback.
📈 1D CHART ANALYSIS — Bigger Trend
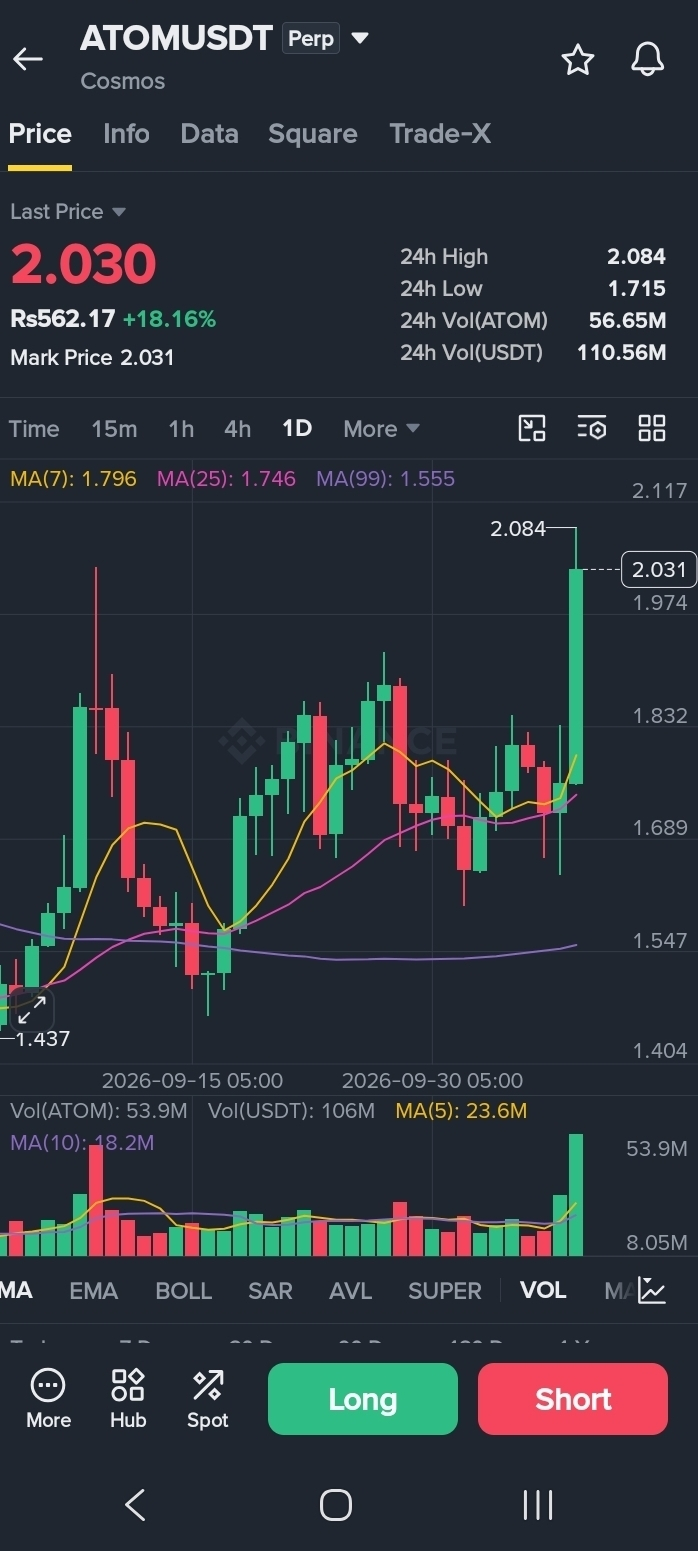
The daily chart also shows a bullish moving-average structure, with ATOM trading above all three displayed averages:
MA(7): $1.796
MA(25): $1.746
MA(99): $1.555
This indicates that the recent price is well above its daily moving-average levels, suggesting strong upward momentum in the broader trend.
Key 1D levels:
Resistance zone: $2.084–$2.117
First support area: $1.90
Deeper support zone: $1.83–$1.75
A daily move above resistance would need confirmation before treating the rally as a sustained breakout. If momentum weakens, the lower support zones become important areas to watch.
🔍 1H vs 1D — What Matters Most?
The 1H chart helps track immediate momentum and short-term support, while the 1D chart gives a broader view of the trend.
Both timeframes currently lean bullish based on the provided moving averages. However, ATOM has already gained significantly, so chasing the rally without confirmation carries risk.
🚀 Bullish Scenario
A confirmed break above $2.084, followed by strength above the $2.10–$2.117 zone, could support further upside.
⚠️ Pullback Scenario
If ATOM is rejected near resistance, watch whether $2.00–$1.97 holds. A breakdown could bring $1.90 and lower support levels into focus.
💬 Your Take
Will ATOM break above $2.10, or is a pullback coming first?
Share your view: bullish continuation or profit-taking?
Disclaimer: This analysis is based on the supplied Binance chart screenshots and is for educational purposes only, not financial advice. Price levels are areas to monitor, not guaranteed outcomes. Perpetual futures involve leverage and liquidation risk. Always do your own research.
#ATOM #Cosmos #CryptoAnalysis #TechnicalAnalysis #BinanceSquare #altcoins