




Bitcoin is bouncing—but buyers still need to prove that this recovery can last.
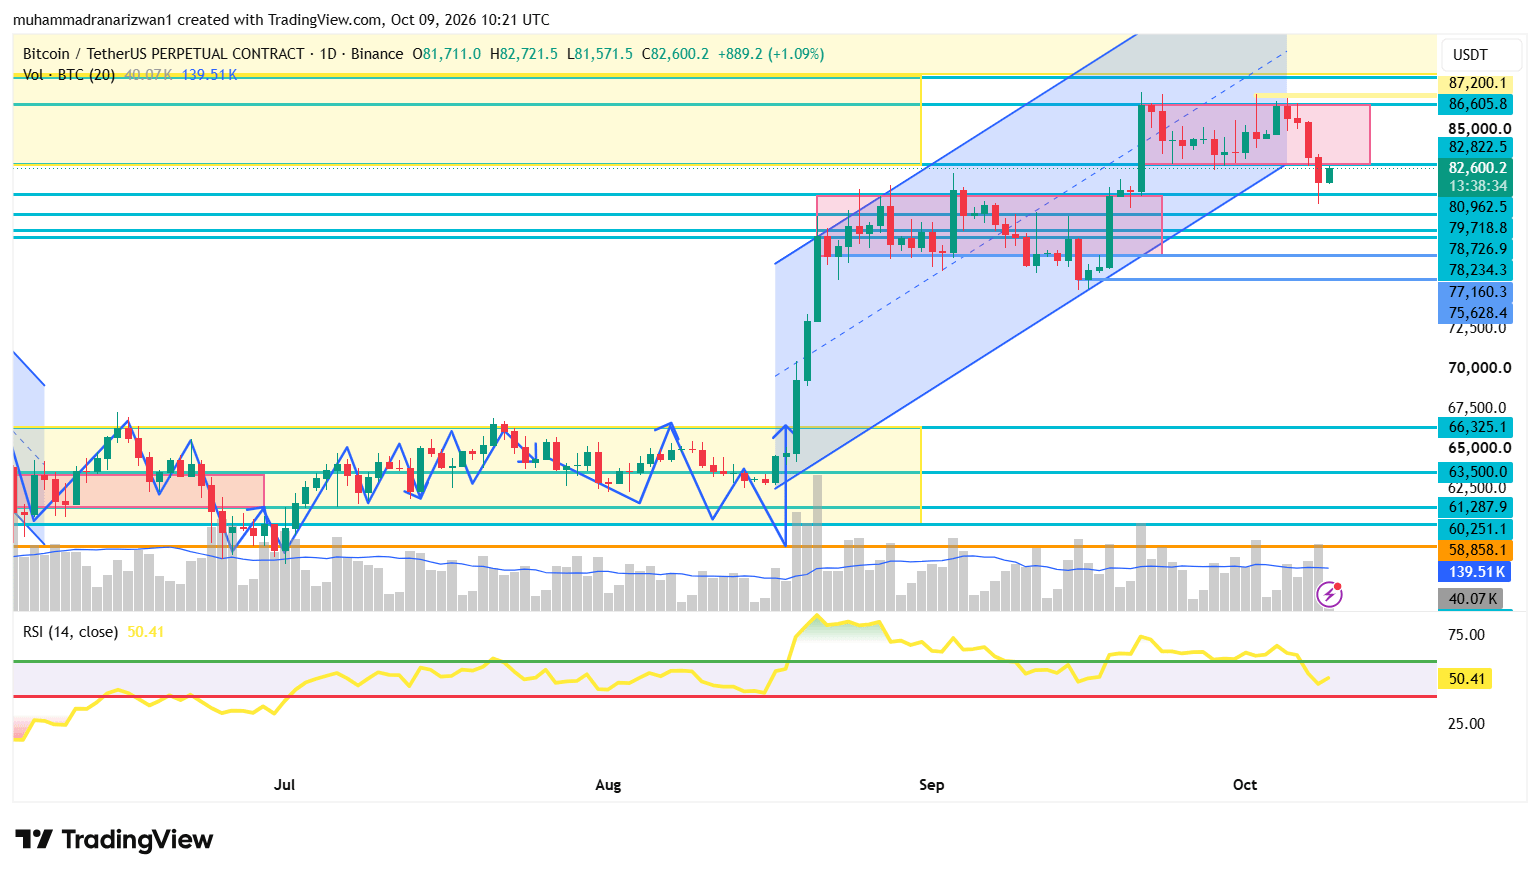
At the October 9 chart snapshot, BTC/USDT perpetual futures were trading near $82,600, up approximately 1.09% on the developing daily candle. Despite that recovery, price remains below an important former support level, leaving the market vulnerable to another rejection.
My current outlook: cautious below $82,822–$83,400, with a stronger recovery case only after a confirmed reclaim.
Here is the structure, the liquidity picture, and two conditional trading setups to watch.
The chart: a bounce beneath broken support
Bitcoin’s earlier advance developed inside an ascending channel. The latest candles have moved below its lower boundary and beneath the consolidation floor around $82,822.
That makes the current bounce a potential retest of broken support. If sellers defend this area, BTC could rotate back toward lower support. If buyers reclaim it and hold above the nearby liquidity zone, the recovery could extend.
The daily RSI is around 50.41, which reflects neutral momentum rather than a strong bullish trend. The supplied dashboard also shows a weaker 4-hour RSI near 41.41, while the 1-hour RSI is around 56.05.
This combination is consistent with a short-term recovery inside a weaker intermediate structure. It does not yet confirm a sustained reversal.
The daily candle is still open, so its price action, RSI and volume readings can change before the close.
The levels that matter
• $82,822: Immediate reclaim level and former range support.
• $83,260–$83,400: Nearby liquidity and the key recovery test.
• $85,000: Next upside reference if the recovery gains traction.
• $86,606–$87,200: Major overhead resistance.
On the downside:
• $80,963: First important marked chart support.
• $80,240–$80,410: Liquidity area highlighted in the dashboard.
• $79,719: Next support if the $80K region fails.
• $78,727–$78,234: Deeper support zone if selling accelerates.
These are decision areas, not guaranteed destinations.
What the liquidity dashboard suggests
The supplied dashboard places an upside liquidation reference near $83,263, with another nearby level around $83,374. Below price, it identifies a downside cluster around $80,307.
One plausible path is a push toward $83.3K followed by rejection and a move back toward $81K–$80.3K. However, a sustained reclaim above that upside zone would weaken this bearish scenario.
Liquidation levels can shift as positions change. They do not establish which side price must visit first.
The dashboard also records approximately $244.13 million in daily US spot Bitcoin ETF net outflows. This is a cautionary input from the supplied report, whose “Last Fill Date” is October 8; it should not be presented as a verified October 9 flow.
It also shows declining open interest and positive funding. That combination does not independently confirm a short entry: declining open interest can reflect positions closing on either side, while positive funding alone cannot predict a reversal.
🔴 Conditional Short Signal: Rejection Near $83.3K
This setup becomes relevant only if BTC rallies into resistance and then shows a clear rejection.
• Watch zone: $83,200–$83,400
• Trigger: A 15-minute or 1-hour rejection followed by a close back below $83,200 and a failed reclaim
• Illustrative entry: Around $83,200 after confirmation
• Stop-loss: $83,850
• Take-profit 1: $82,000
• Take-profit 2: $81,000
• Take-profit 3: $80,350
At the illustrative entry, the price risk is $650 per BTC. The approximate reward-to-risk ratios are 1.85R, 3.38R and 4.38R, before fees, funding and slippage.
Invalidation: Sustained acceptance above $83,400 weakens the rejection thesis. If that happens, skip the setup rather than entering simply because price reached the zone.
🟢 Conditional Long Signal: Reclaim and Hold
A long becomes more attractive if buyers turn the resistance area into support.
• Trigger: A 1-hour close above $83,400, followed by a successful retest and a higher low
• Potential entry zone: $83,350–$83,500 after confirmation
• Illustrative entry: $83,450
• Stop-loss: $82,750
• Take-profit 1: $85,000
• Take-profit 2: $86,600
• Take-profit 3: $87,200
At the illustrative entry, the price risk is $700 per BTC. The approximate reward-to-risk ratios are 2.21R, 4.50R and 5.36R, before trading costs.
Invalidation: A failed retest and a move back below $82,822 would undermine the recovery setup.
The higher targets may require more than one session. Neither setup is an instruction to enter immediately at the snapshot price.
Risk management comes before direction
Use only the setup that confirms. Keep risk small—for example, 0.5% of account equity per trade—and calculate position size from the distance to the stop. Leverage does not reduce the loss associated with a given position size.
Consider taking partial profits at the first target, and avoid widening the stop to keep a losing trade open. If price moves away before a valid entry appears, let the trade go.
My next-move assessment
A test of $82,822–$83,400 is the immediate recovery scenario to monitor. Rejection there would keep $80,963 and $80,300 in focus. A confirmed reclaim above $83,400 would improve the case for $85,000, followed by the higher resistance zone.
If BTC loses $80,963 before reclaiming resistance, downside continuation could occur without an upside sweep first.
For now, the bounce is visible. A lasting reversal still needs confirmation.
Analysis based on the October 9, 2026 chart captured around 3:21 PM Pakistan time and the supplied monitoring dashboard. Check current prices before acting. Educational analysis only; no outcome is guaranteed.
#BitcoinETFs #BTC #BTCUSDTAnalysis #CryptoTradingInsights #BitcoinAnalysis2026