
This analysis focuses on the current price structure of BTCUSD using market structure, liquidity,
order blocks, BOS/CHoCH, and key support/resistance areas.
Price has previously established a strong bullish expansion from the 80,000–80,500 order block and reversal area, followed by a significant move toward the 86,500–87,000 resistance zone. After reaching that area, price began showing signs of rejection and has since moved lower, creating a short-term bearish sequence.
Current Market Structure
The recent decline from the resistance area has brought price back toward the 82,800–83,300 region, which is currently an important area to monitor.
The chart highlights a 0.5 level around this region, together with a marked strong-low area. A reaction here could determine whether price develops a temporary recovery or continues toward the deeper buying zone.
The broader structure remains important: despite the recent bearish pullback, price is still trading above the major 80,000–80,500 buying/order-block zone.
Liquidity & Potential Price Path
The current move lower may be seeking liquidity beneath the recent lows before a potential recovery.
One possible scenario illustrated on the chart is a deeper liquidity sweep toward the 80,000–80,500 buying zone, followed by a bullish reaction and gradual recovery.
If price reacts strongly from this area and begins forming bullish internal structure, the market could potentially revisit the intermediate levels and eventually challenge the 86,500–87,000 resistance zone.
The projected path is only a possible scenario and should not be interpreted as a guaranteed market direction.
Key Zones
82,800–83,300 — 0.5 Level / Current Reaction Zone
This is the first important area to monitor. A strong reaction could lead to a corrective recovery, while a decisive breakdown could expose lower liquidity.
80,000–80,500 — Major Buying / Order Block Zone
This is the key demand area marked on the chart. It previously acted as an important reversal region and remains a significant level if price continues lower.
86,500–87,000 — Major Resistance Zone
This area contains previous highs and multiple ERL/high liquidity references. A reaction here could produce another significant pullback, while sustained acceptance above it would indicate increasing bullish strength. $BTC $NVDAB $ZEC


Artikel
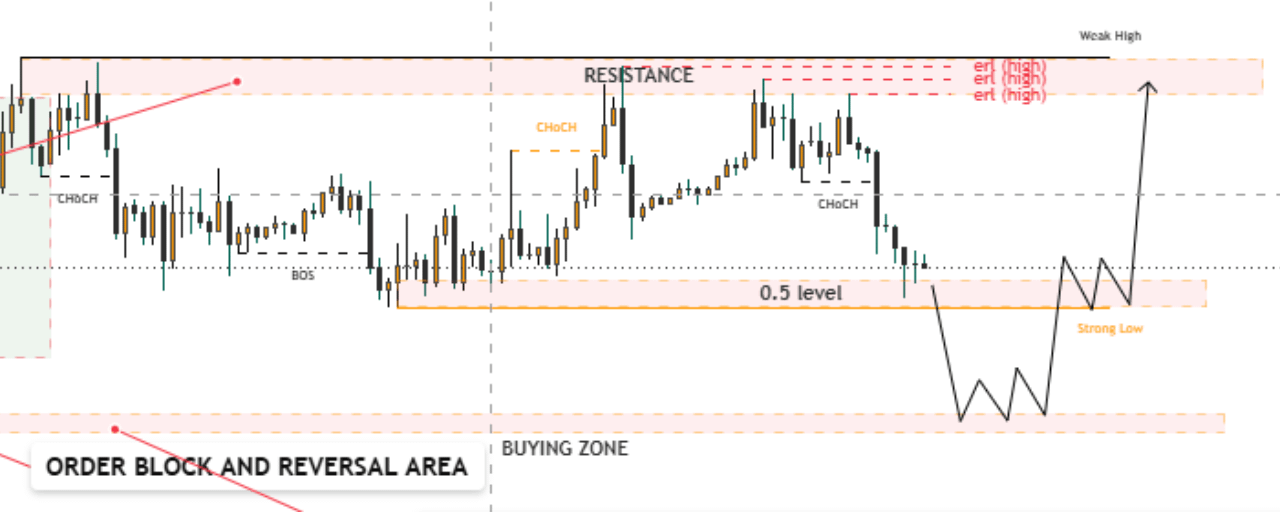
BTCUSD — Market Structure, Liquidity & Order Block Analysis
Haftungsausschluss: Enthält Meinungen von Drittanbietern. Keine Beratung. Binance AI wird ohne Gewähr bereitgestellt. Siehe AGB.